A Supplemental Information About Assessment Design and Development
A.1 Differential Item Functioning Plots
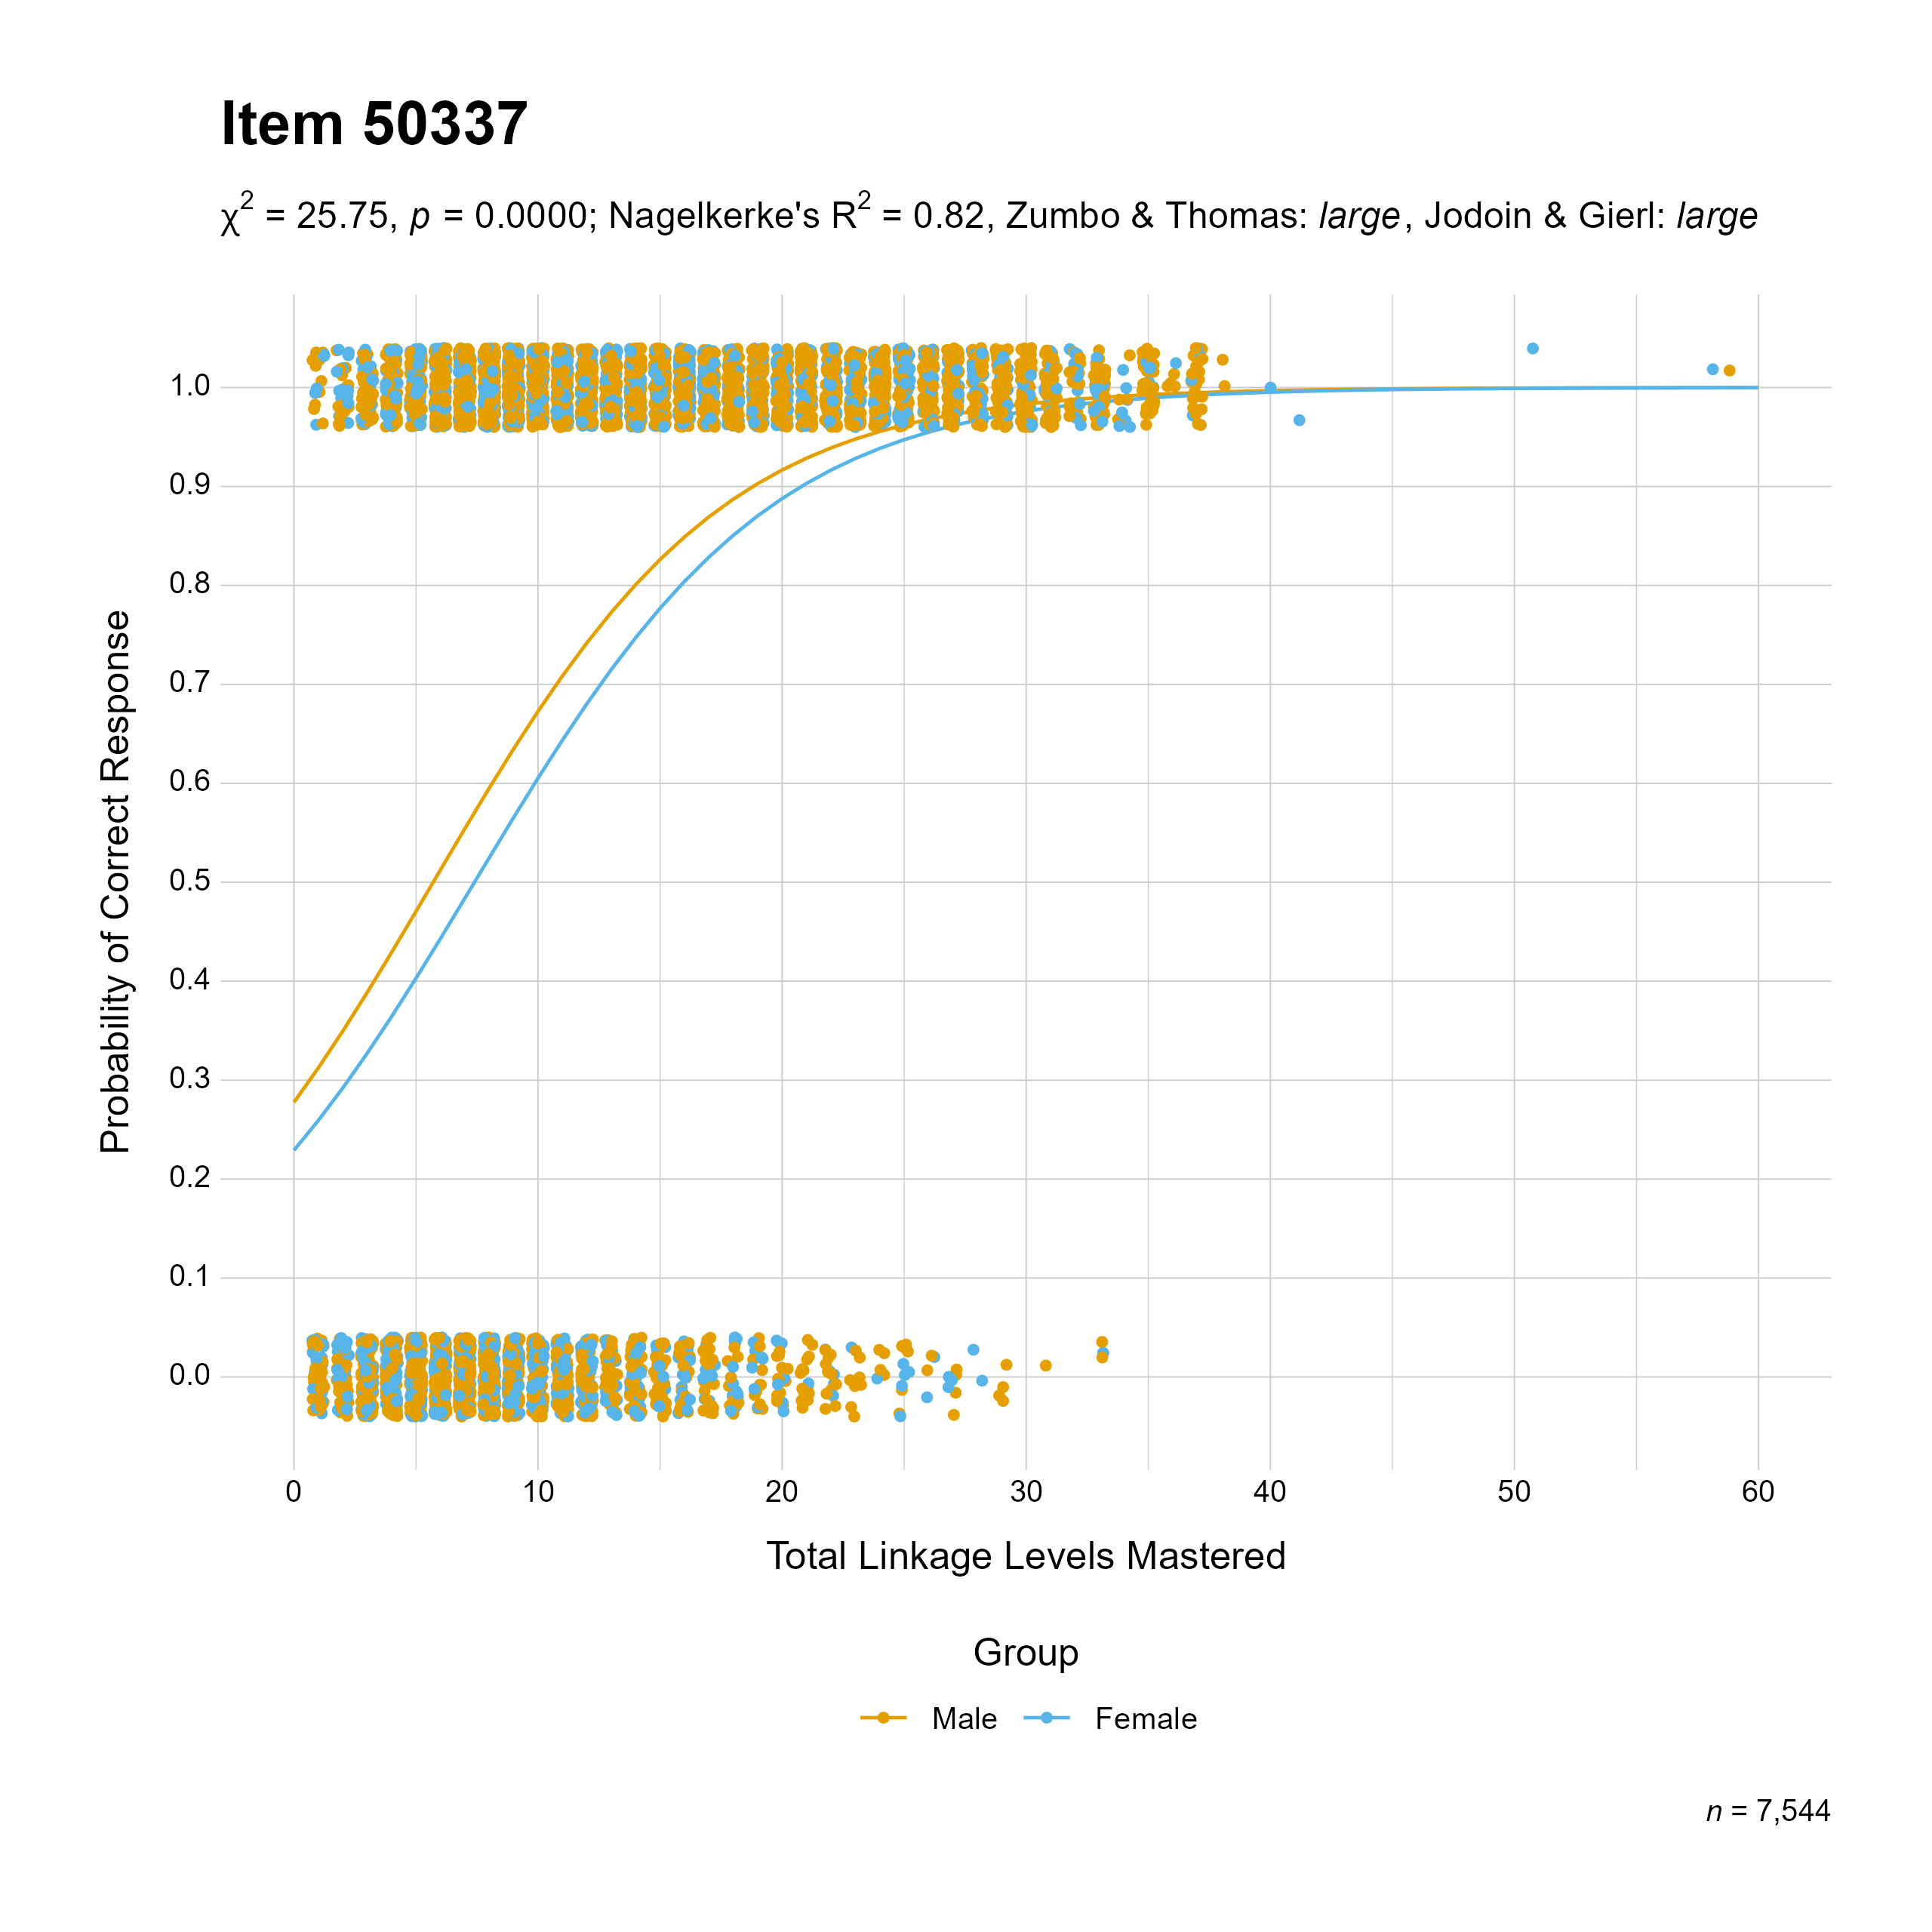
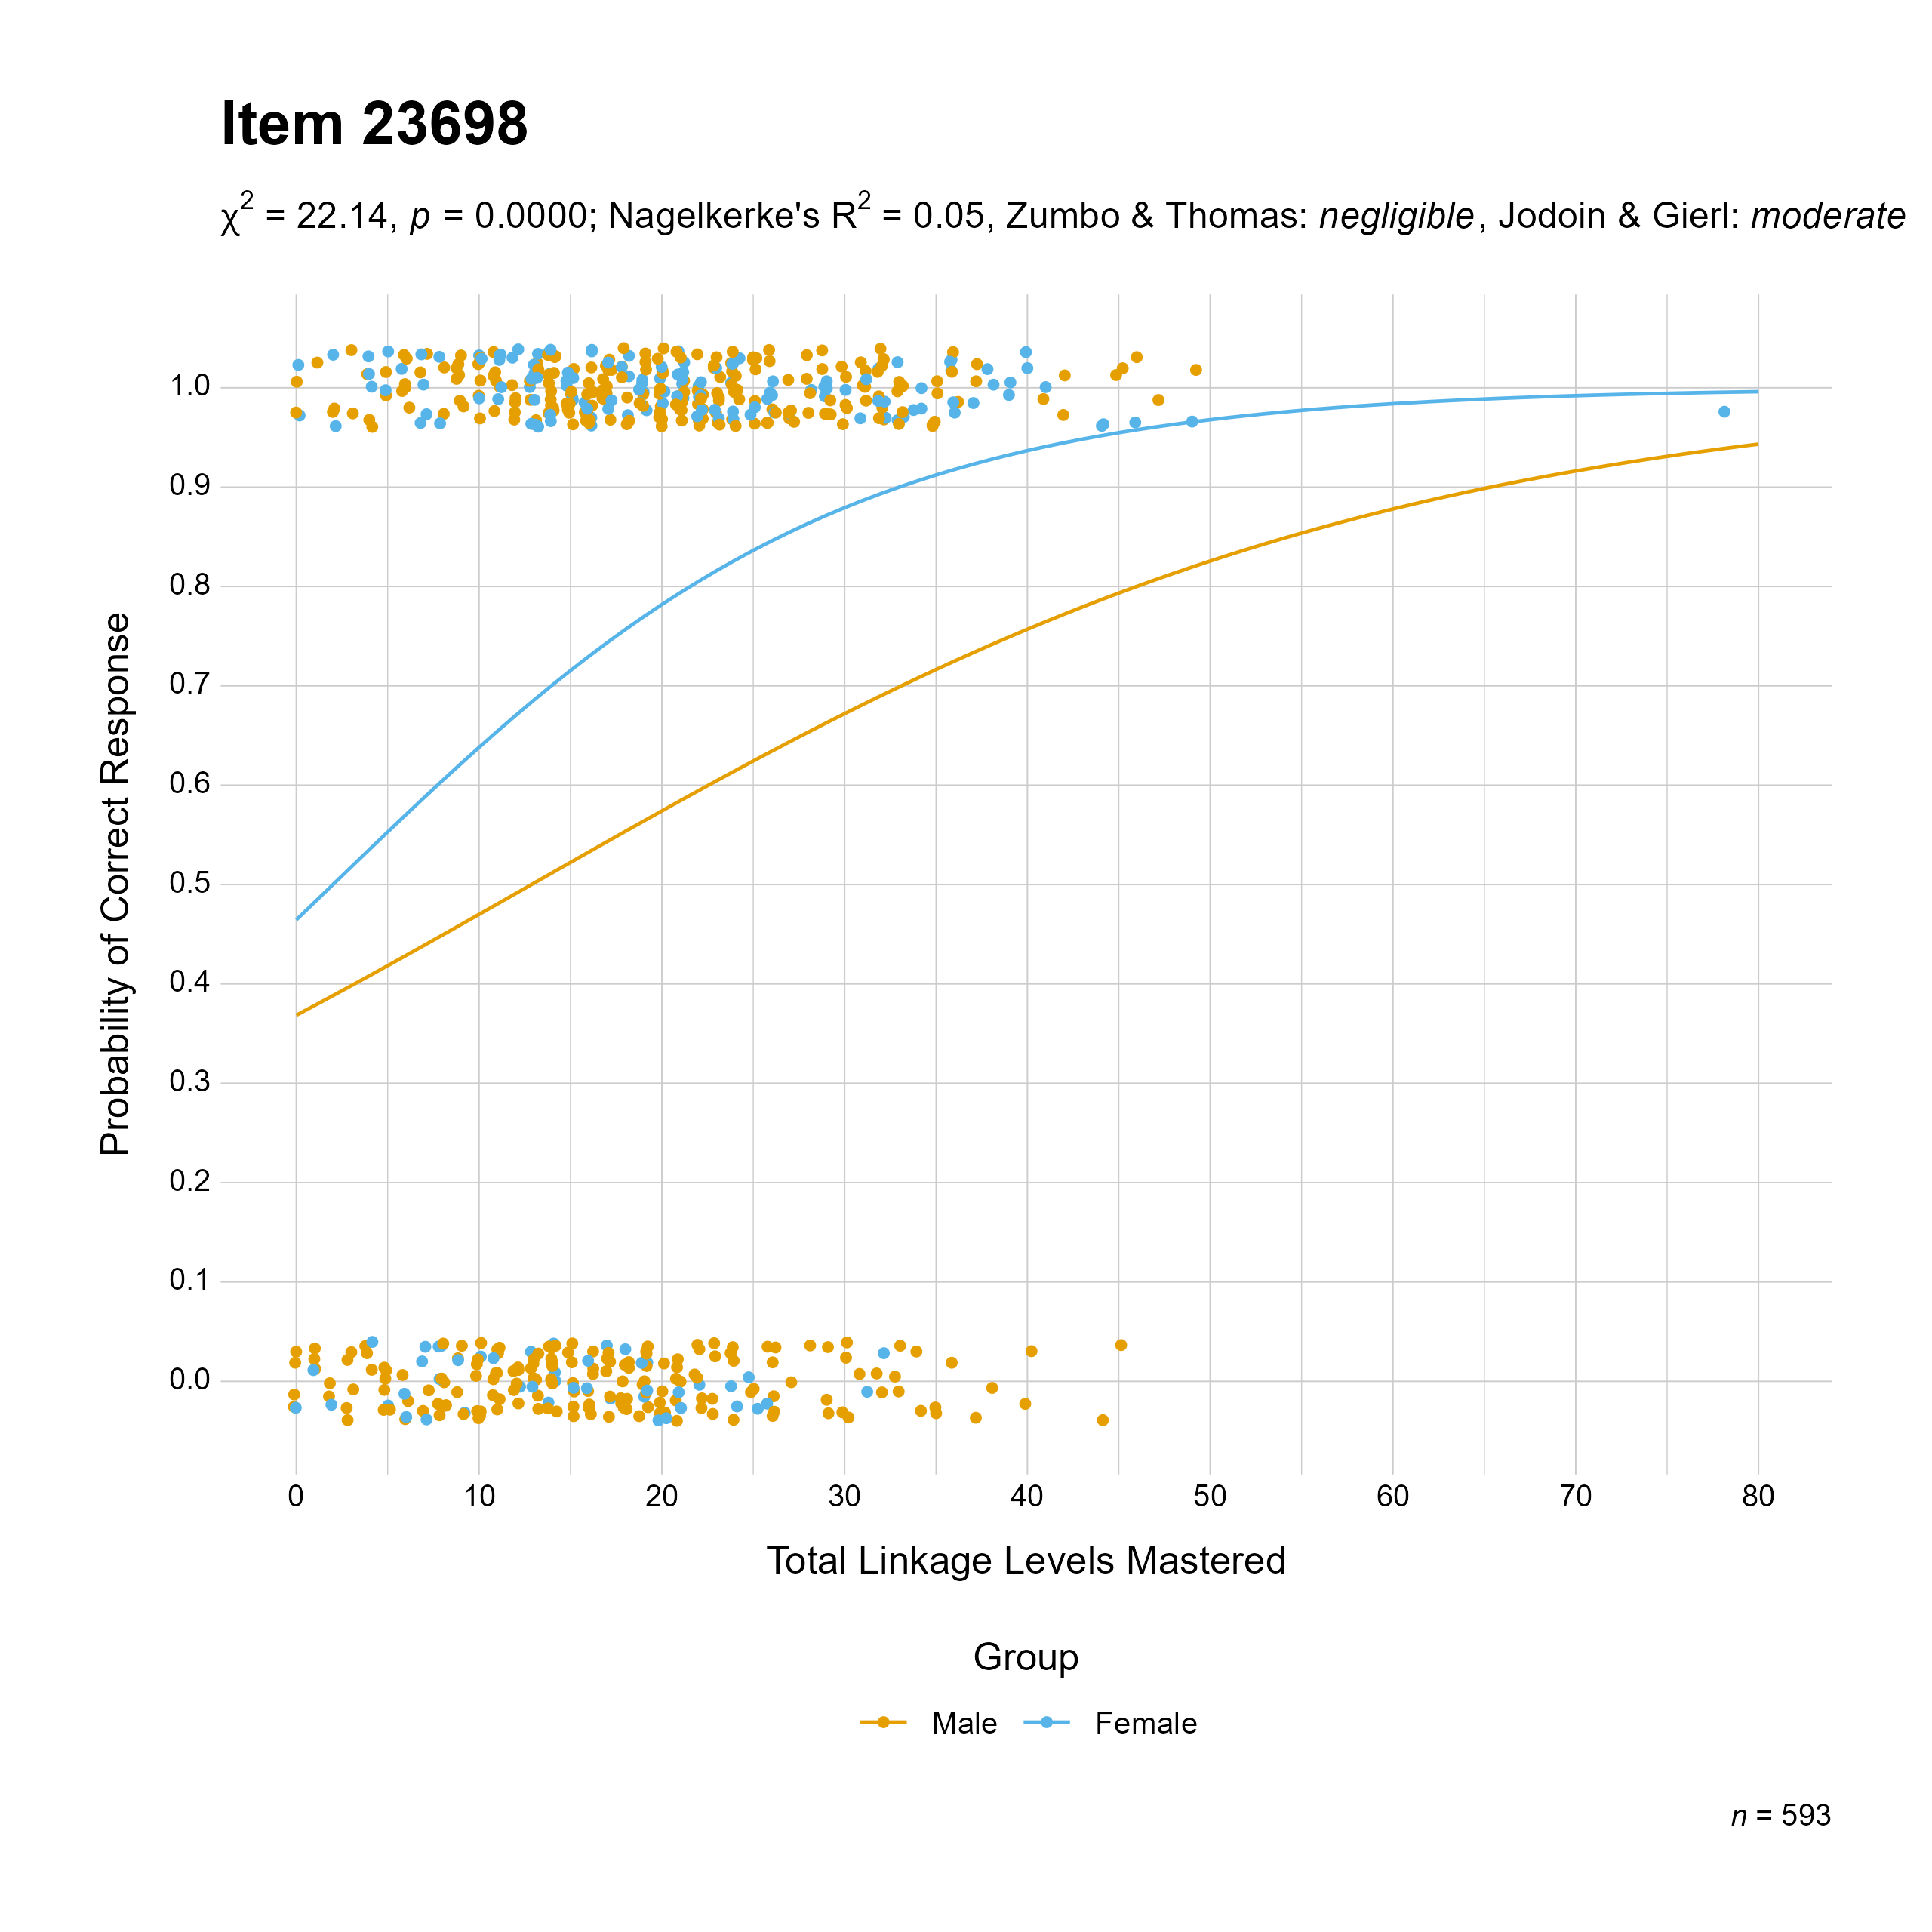
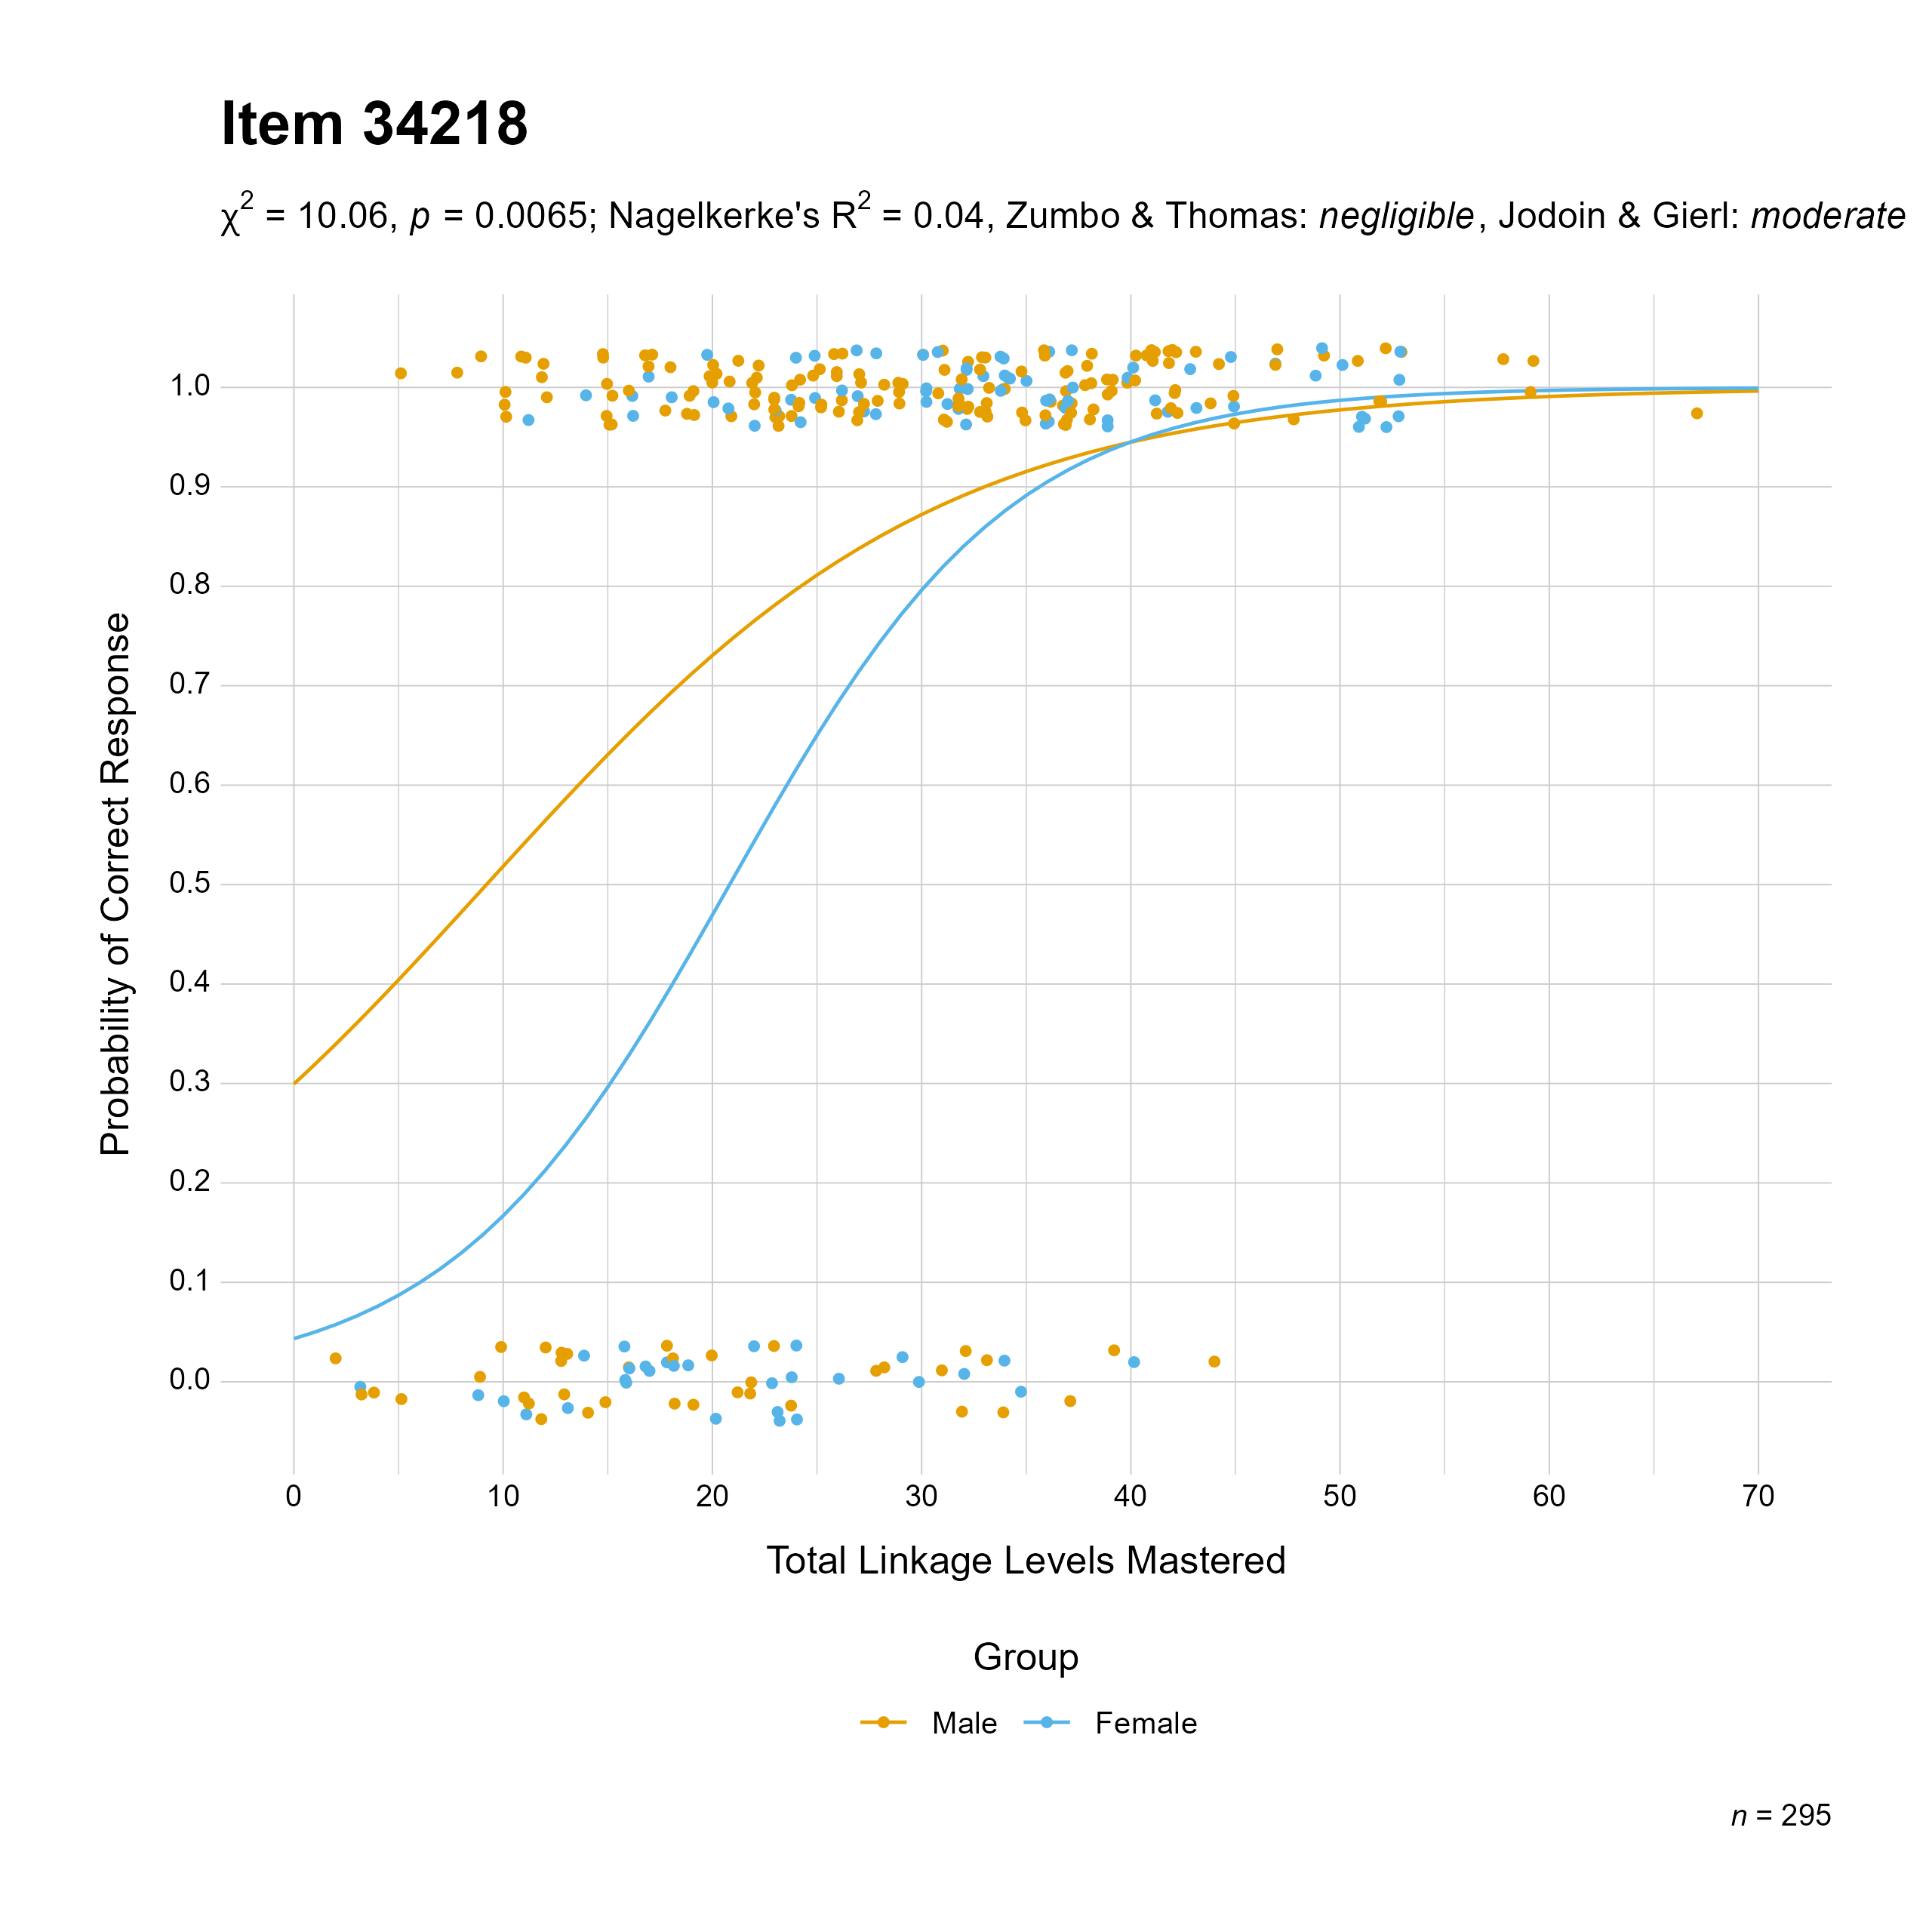
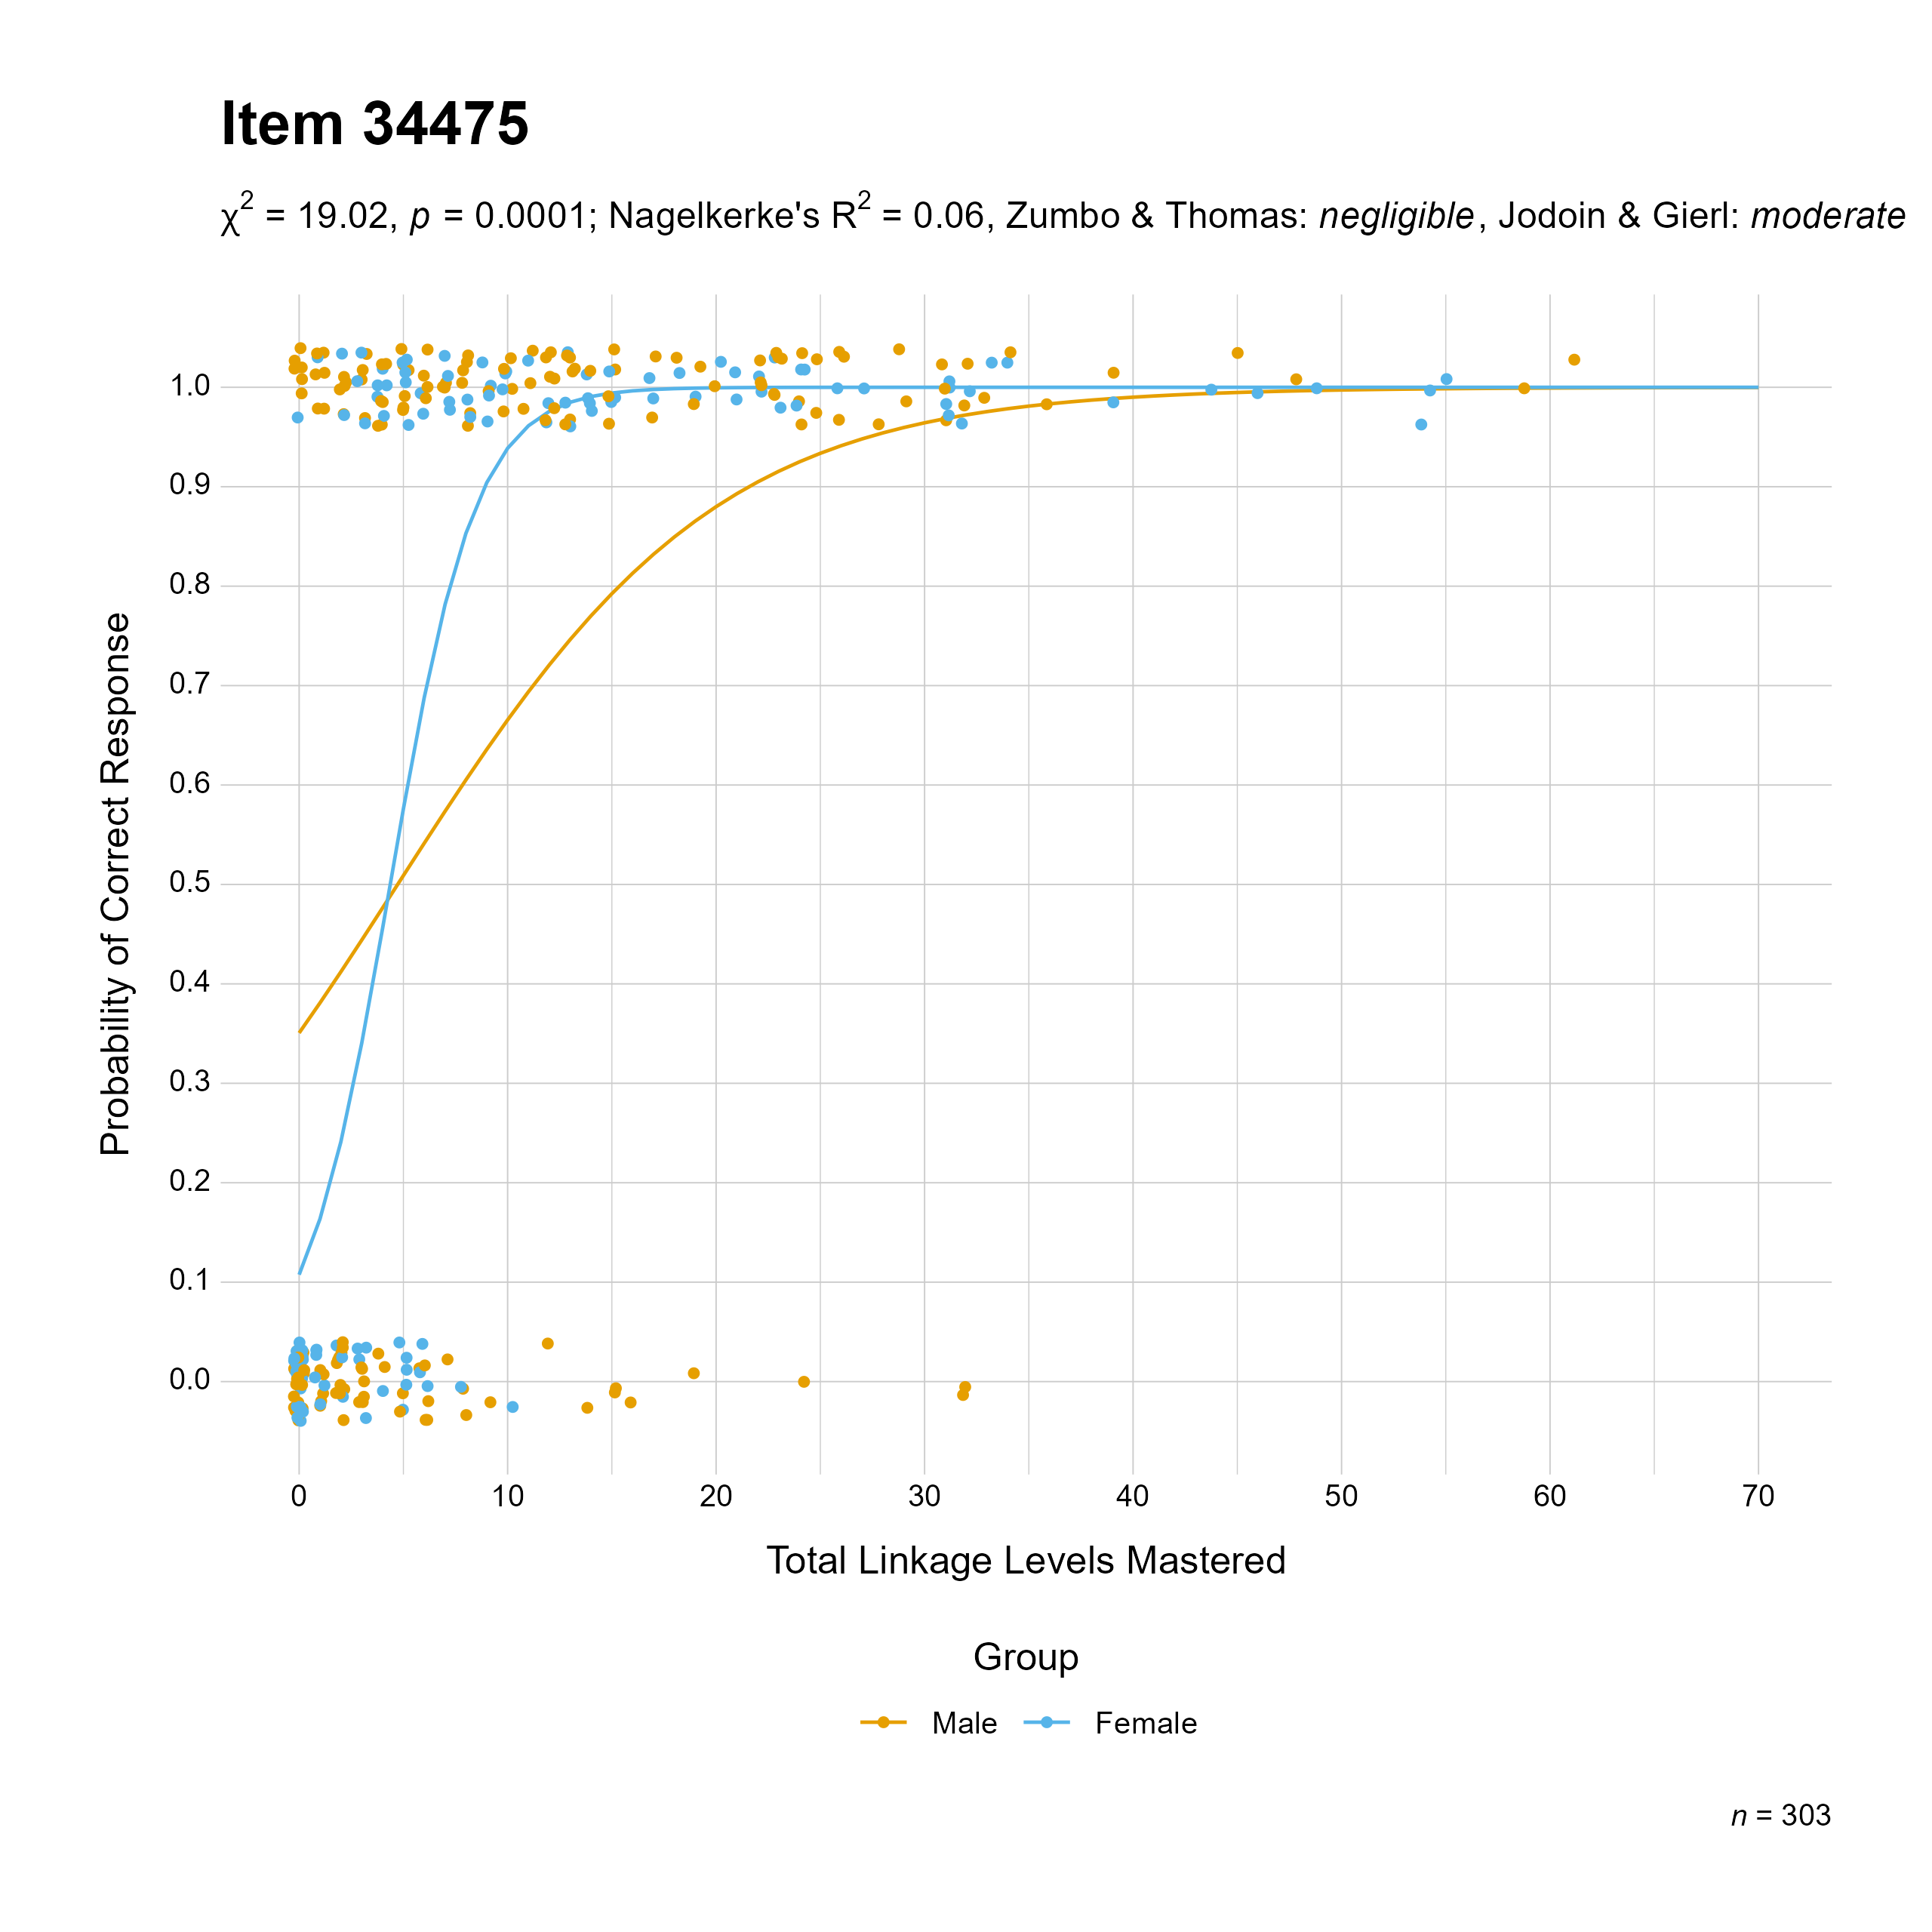
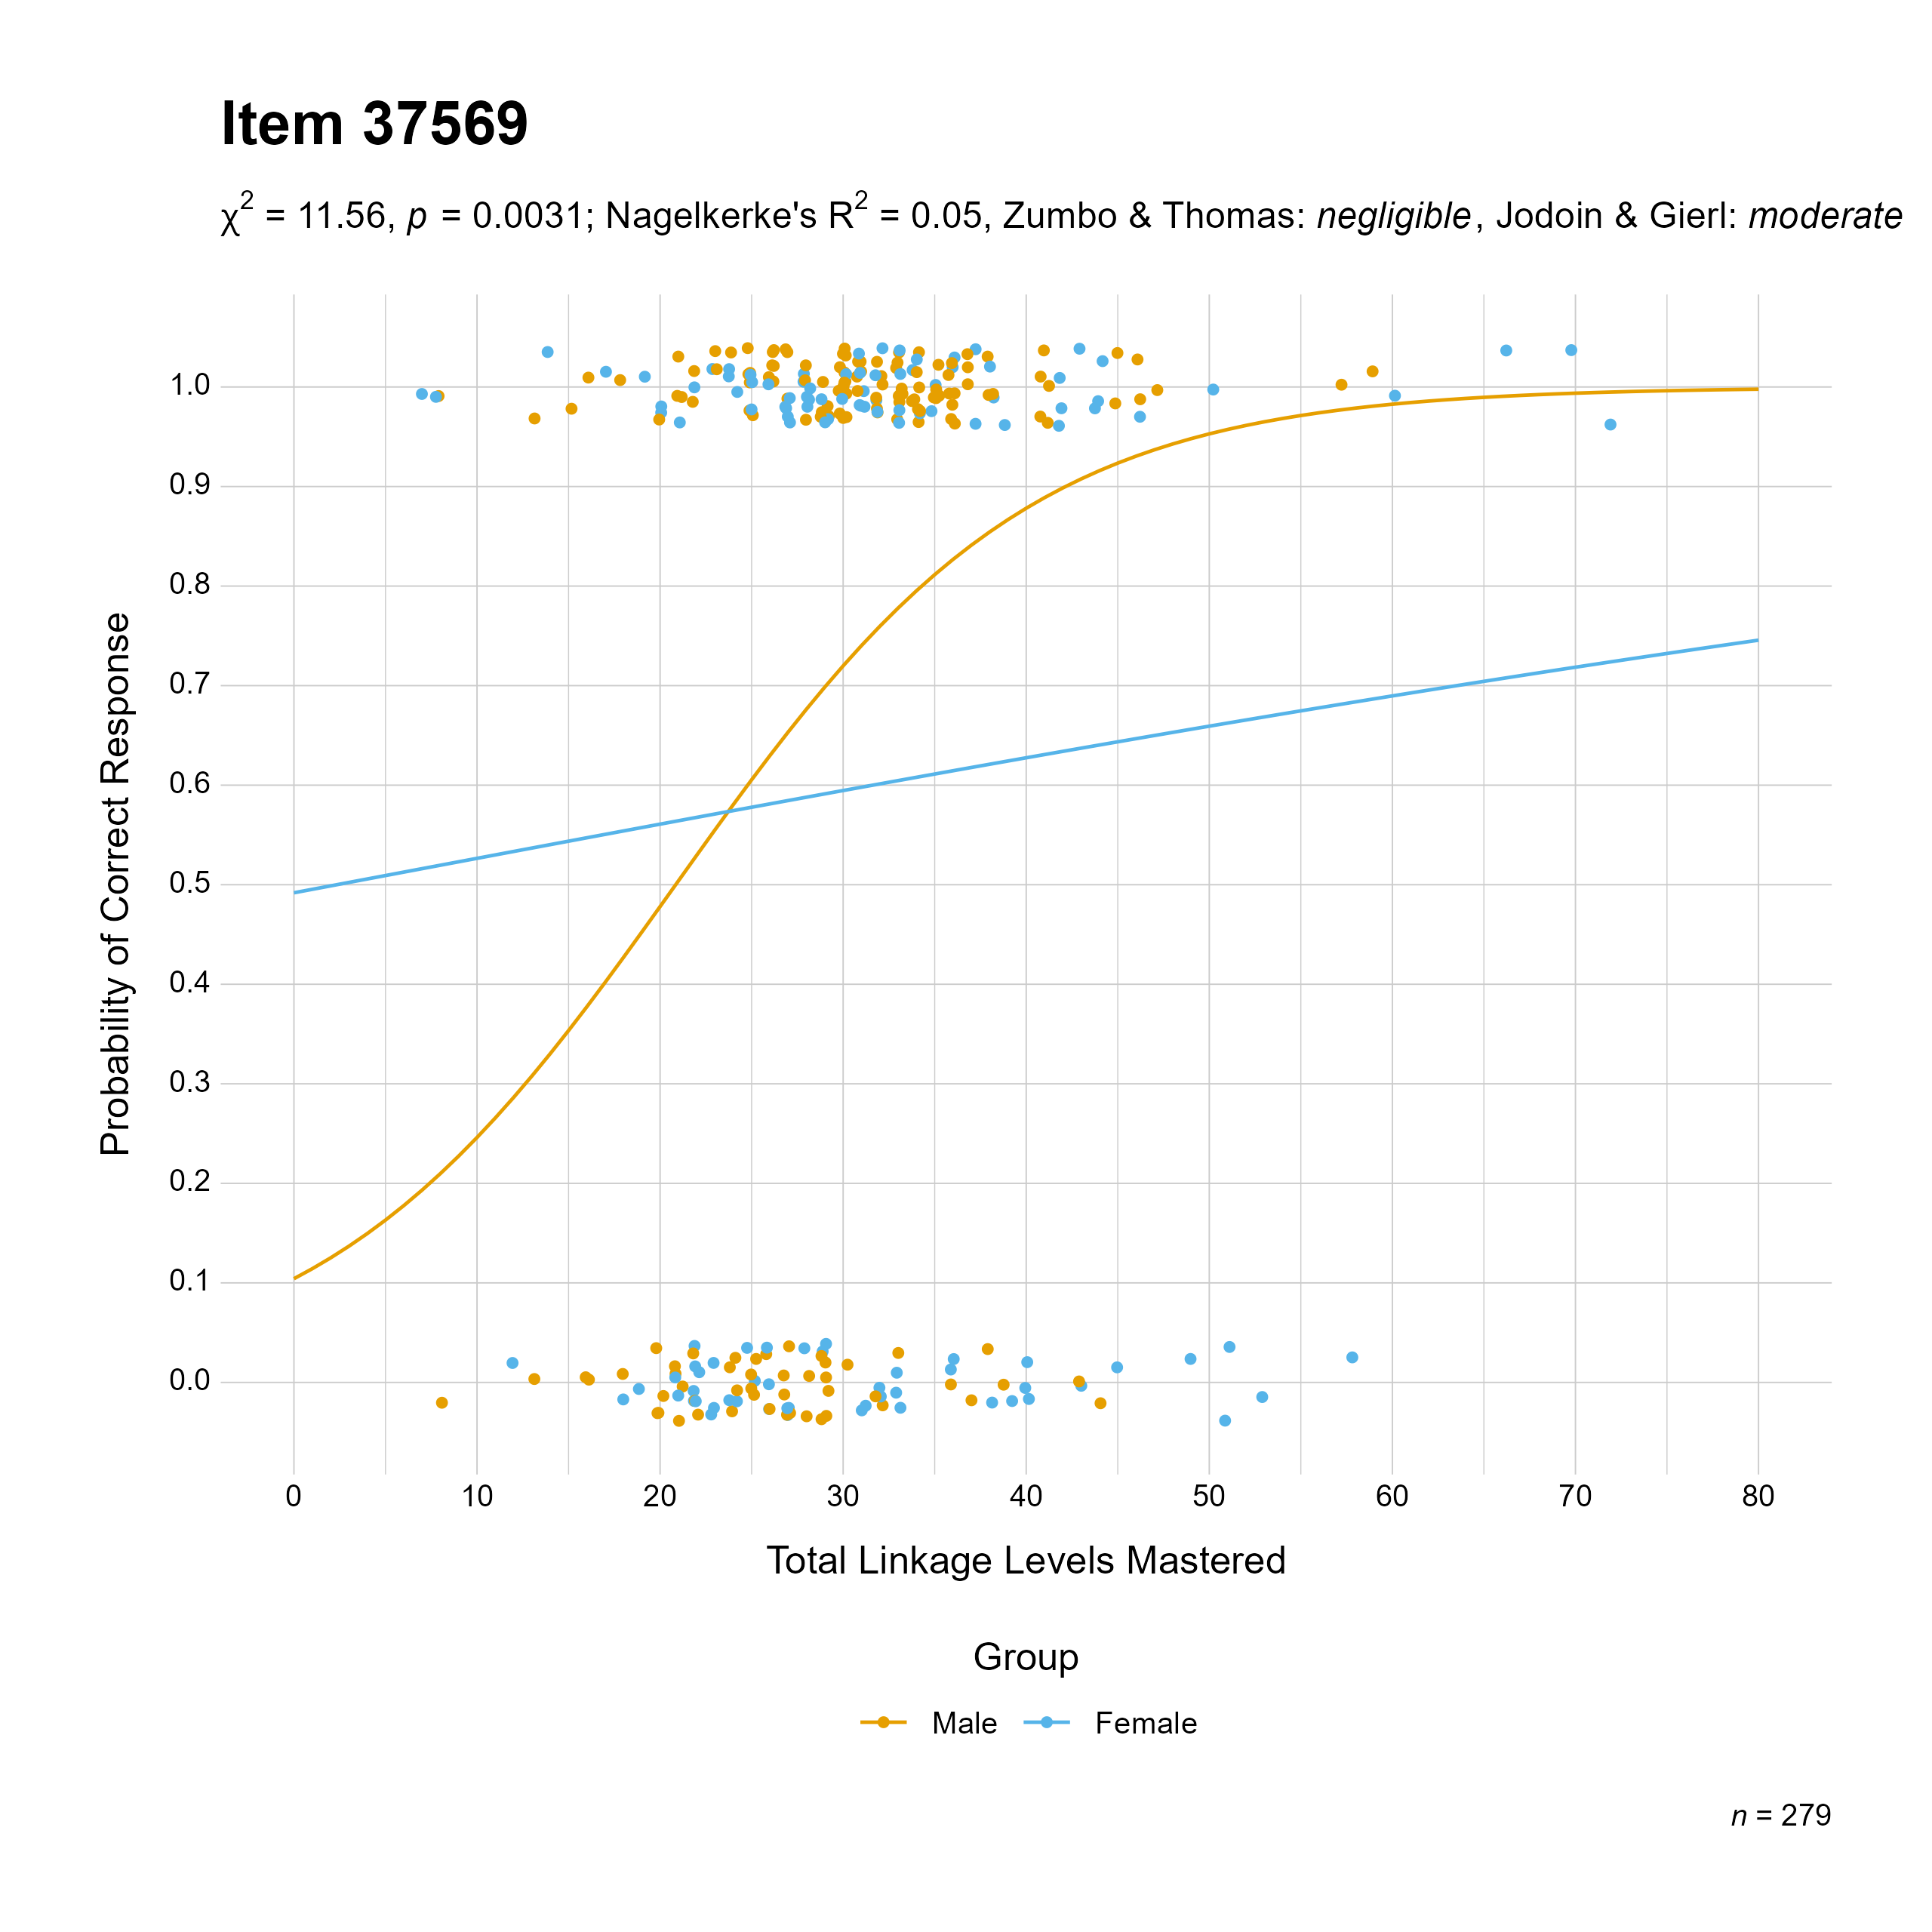
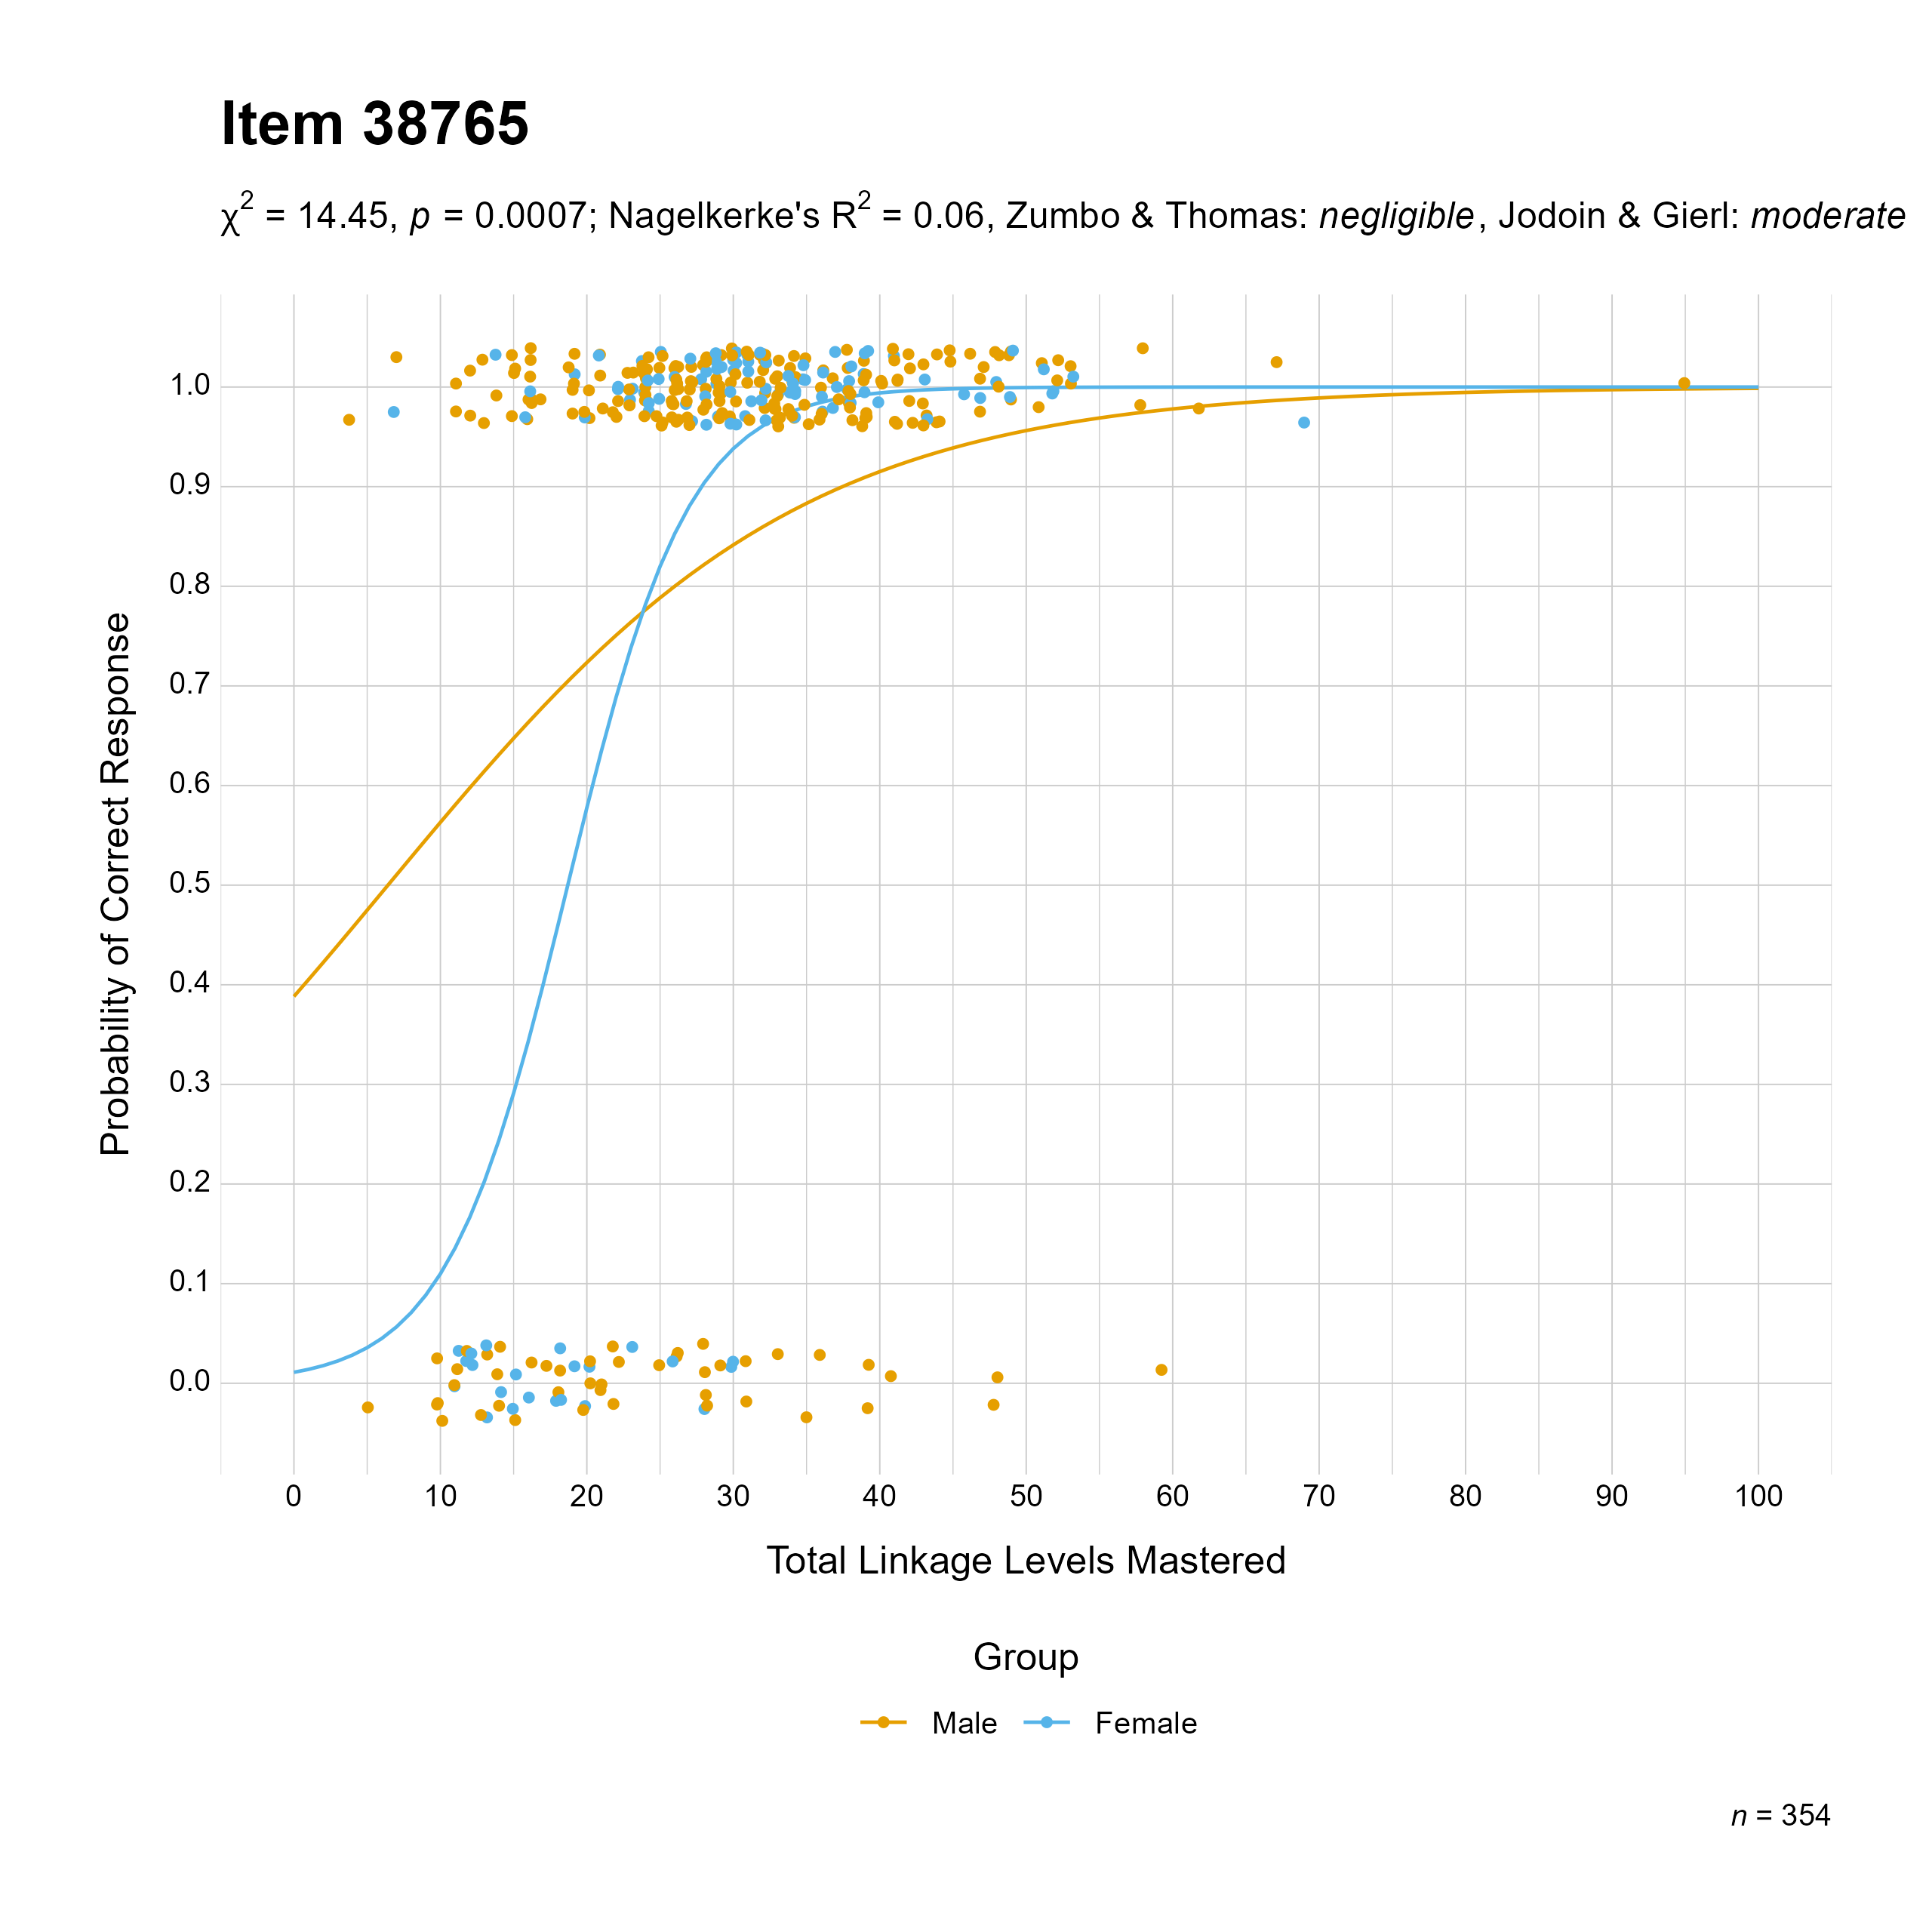
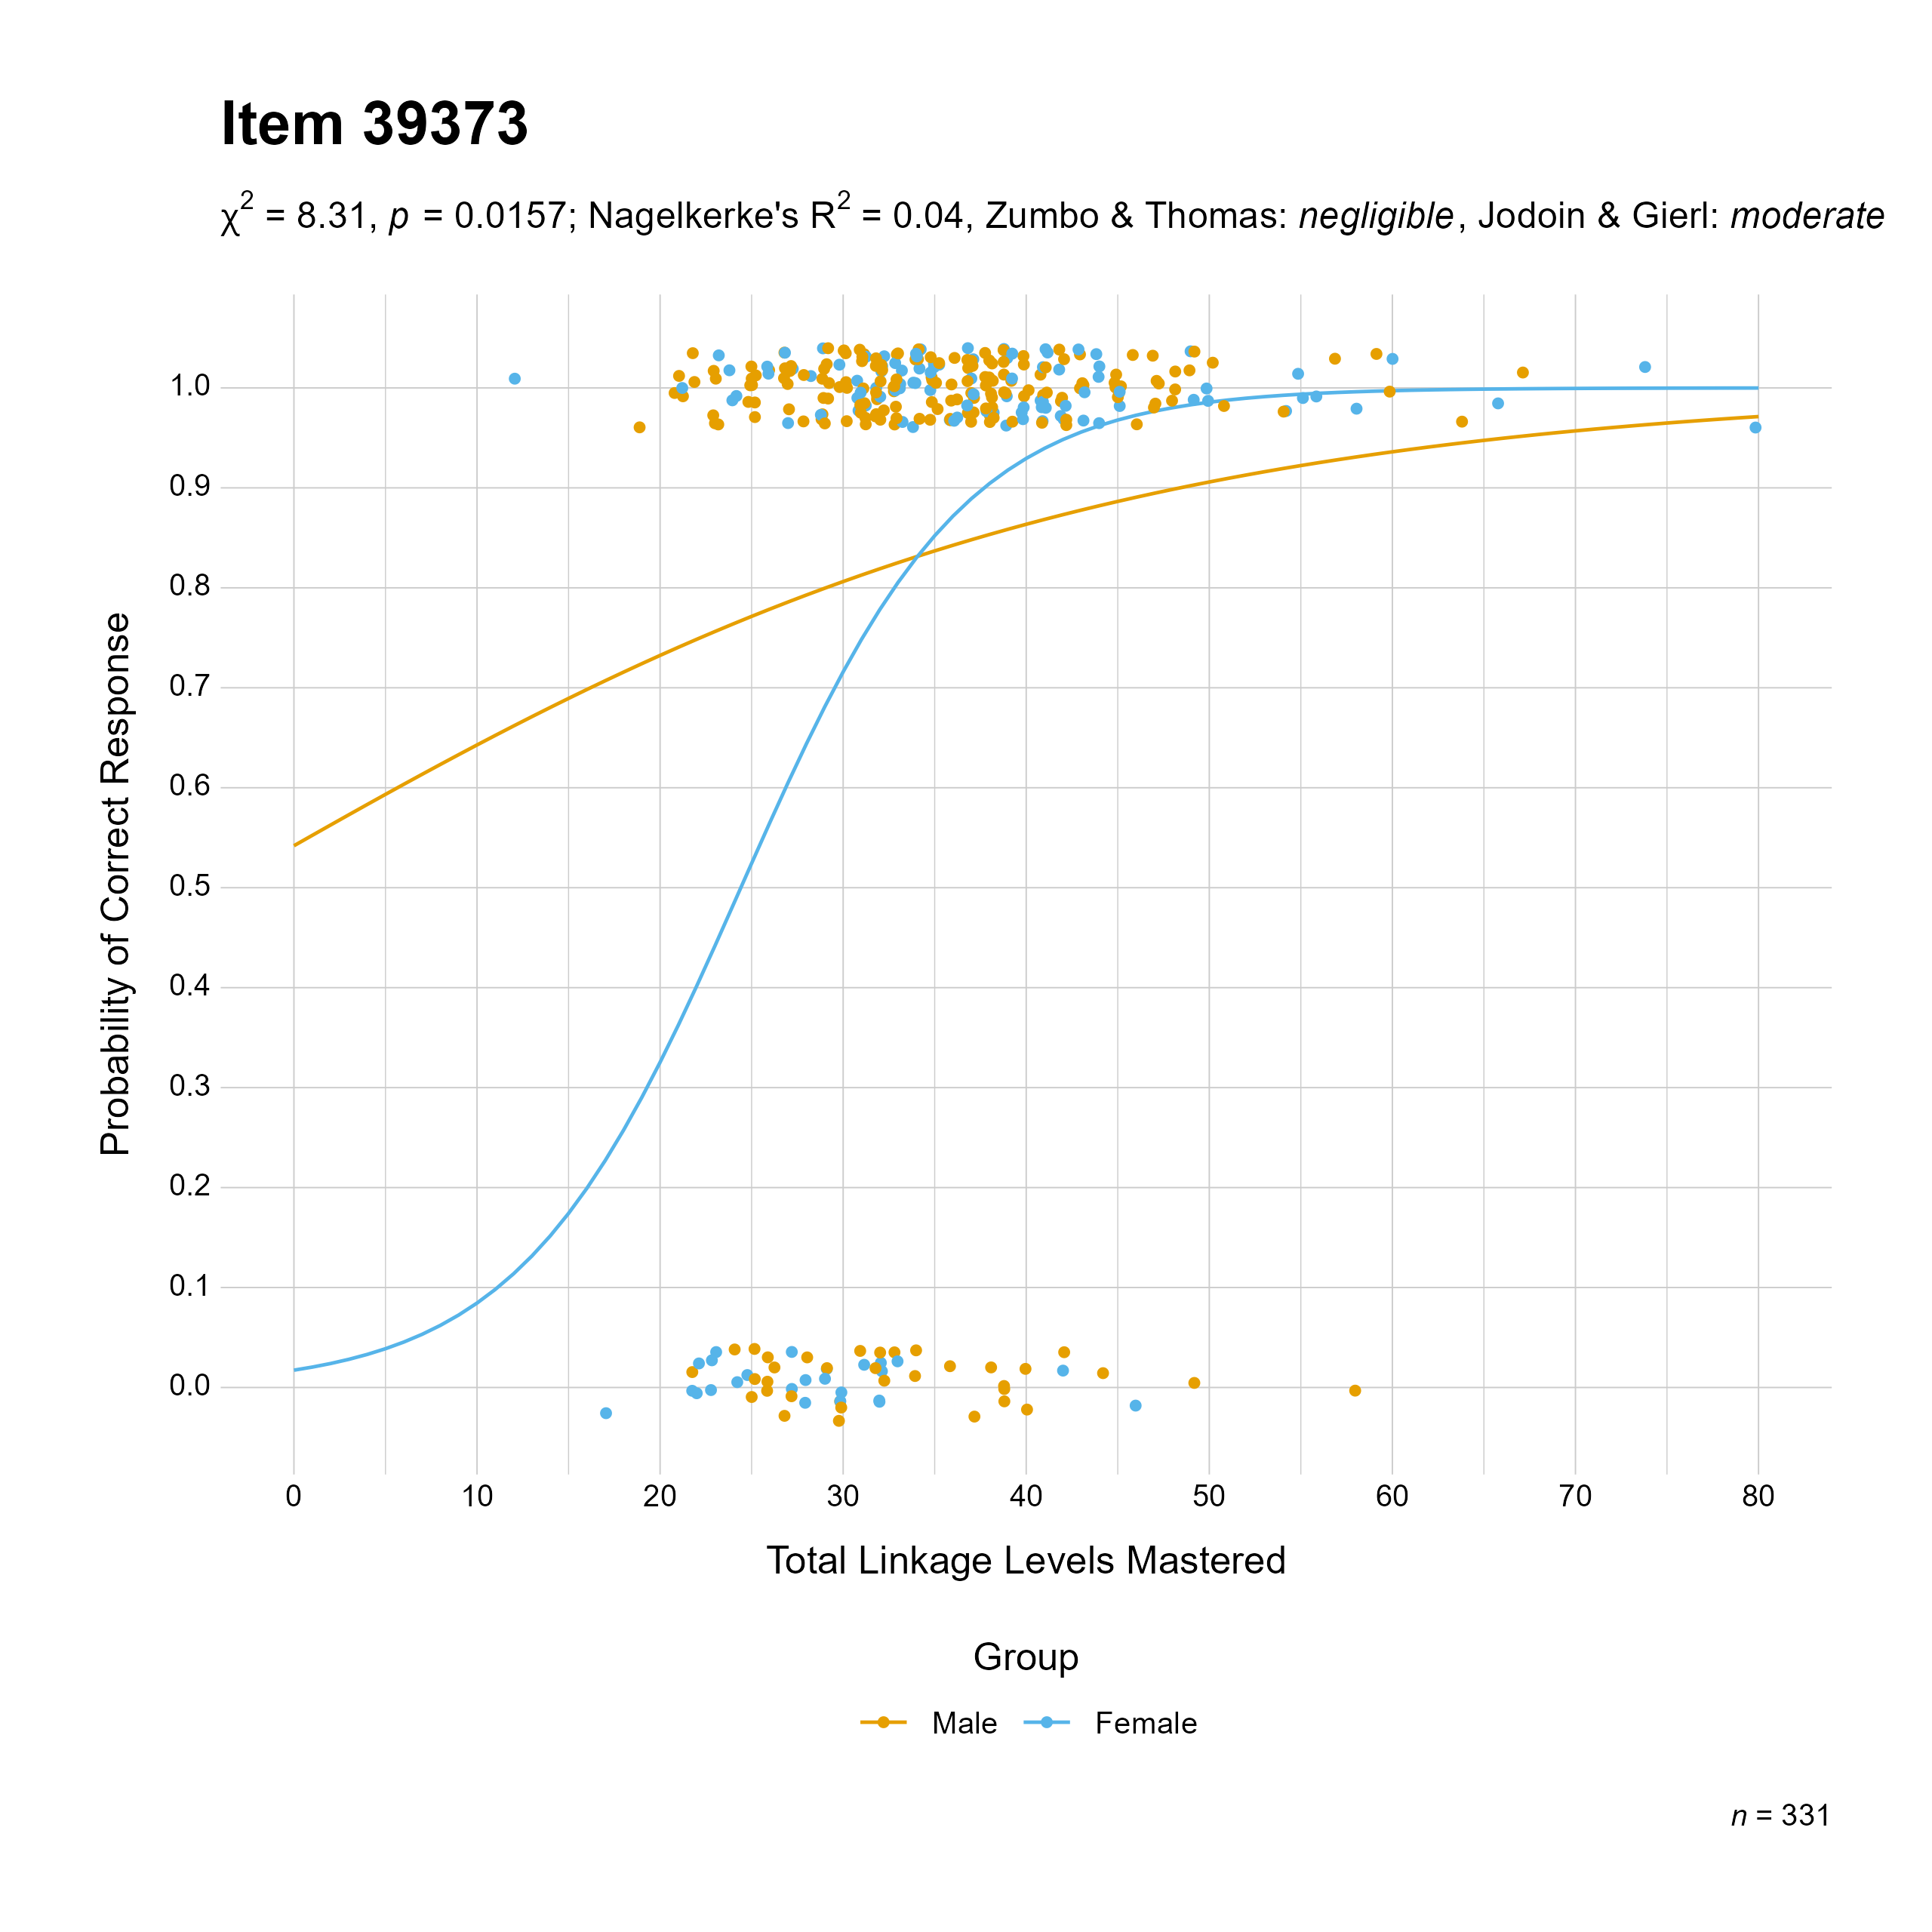
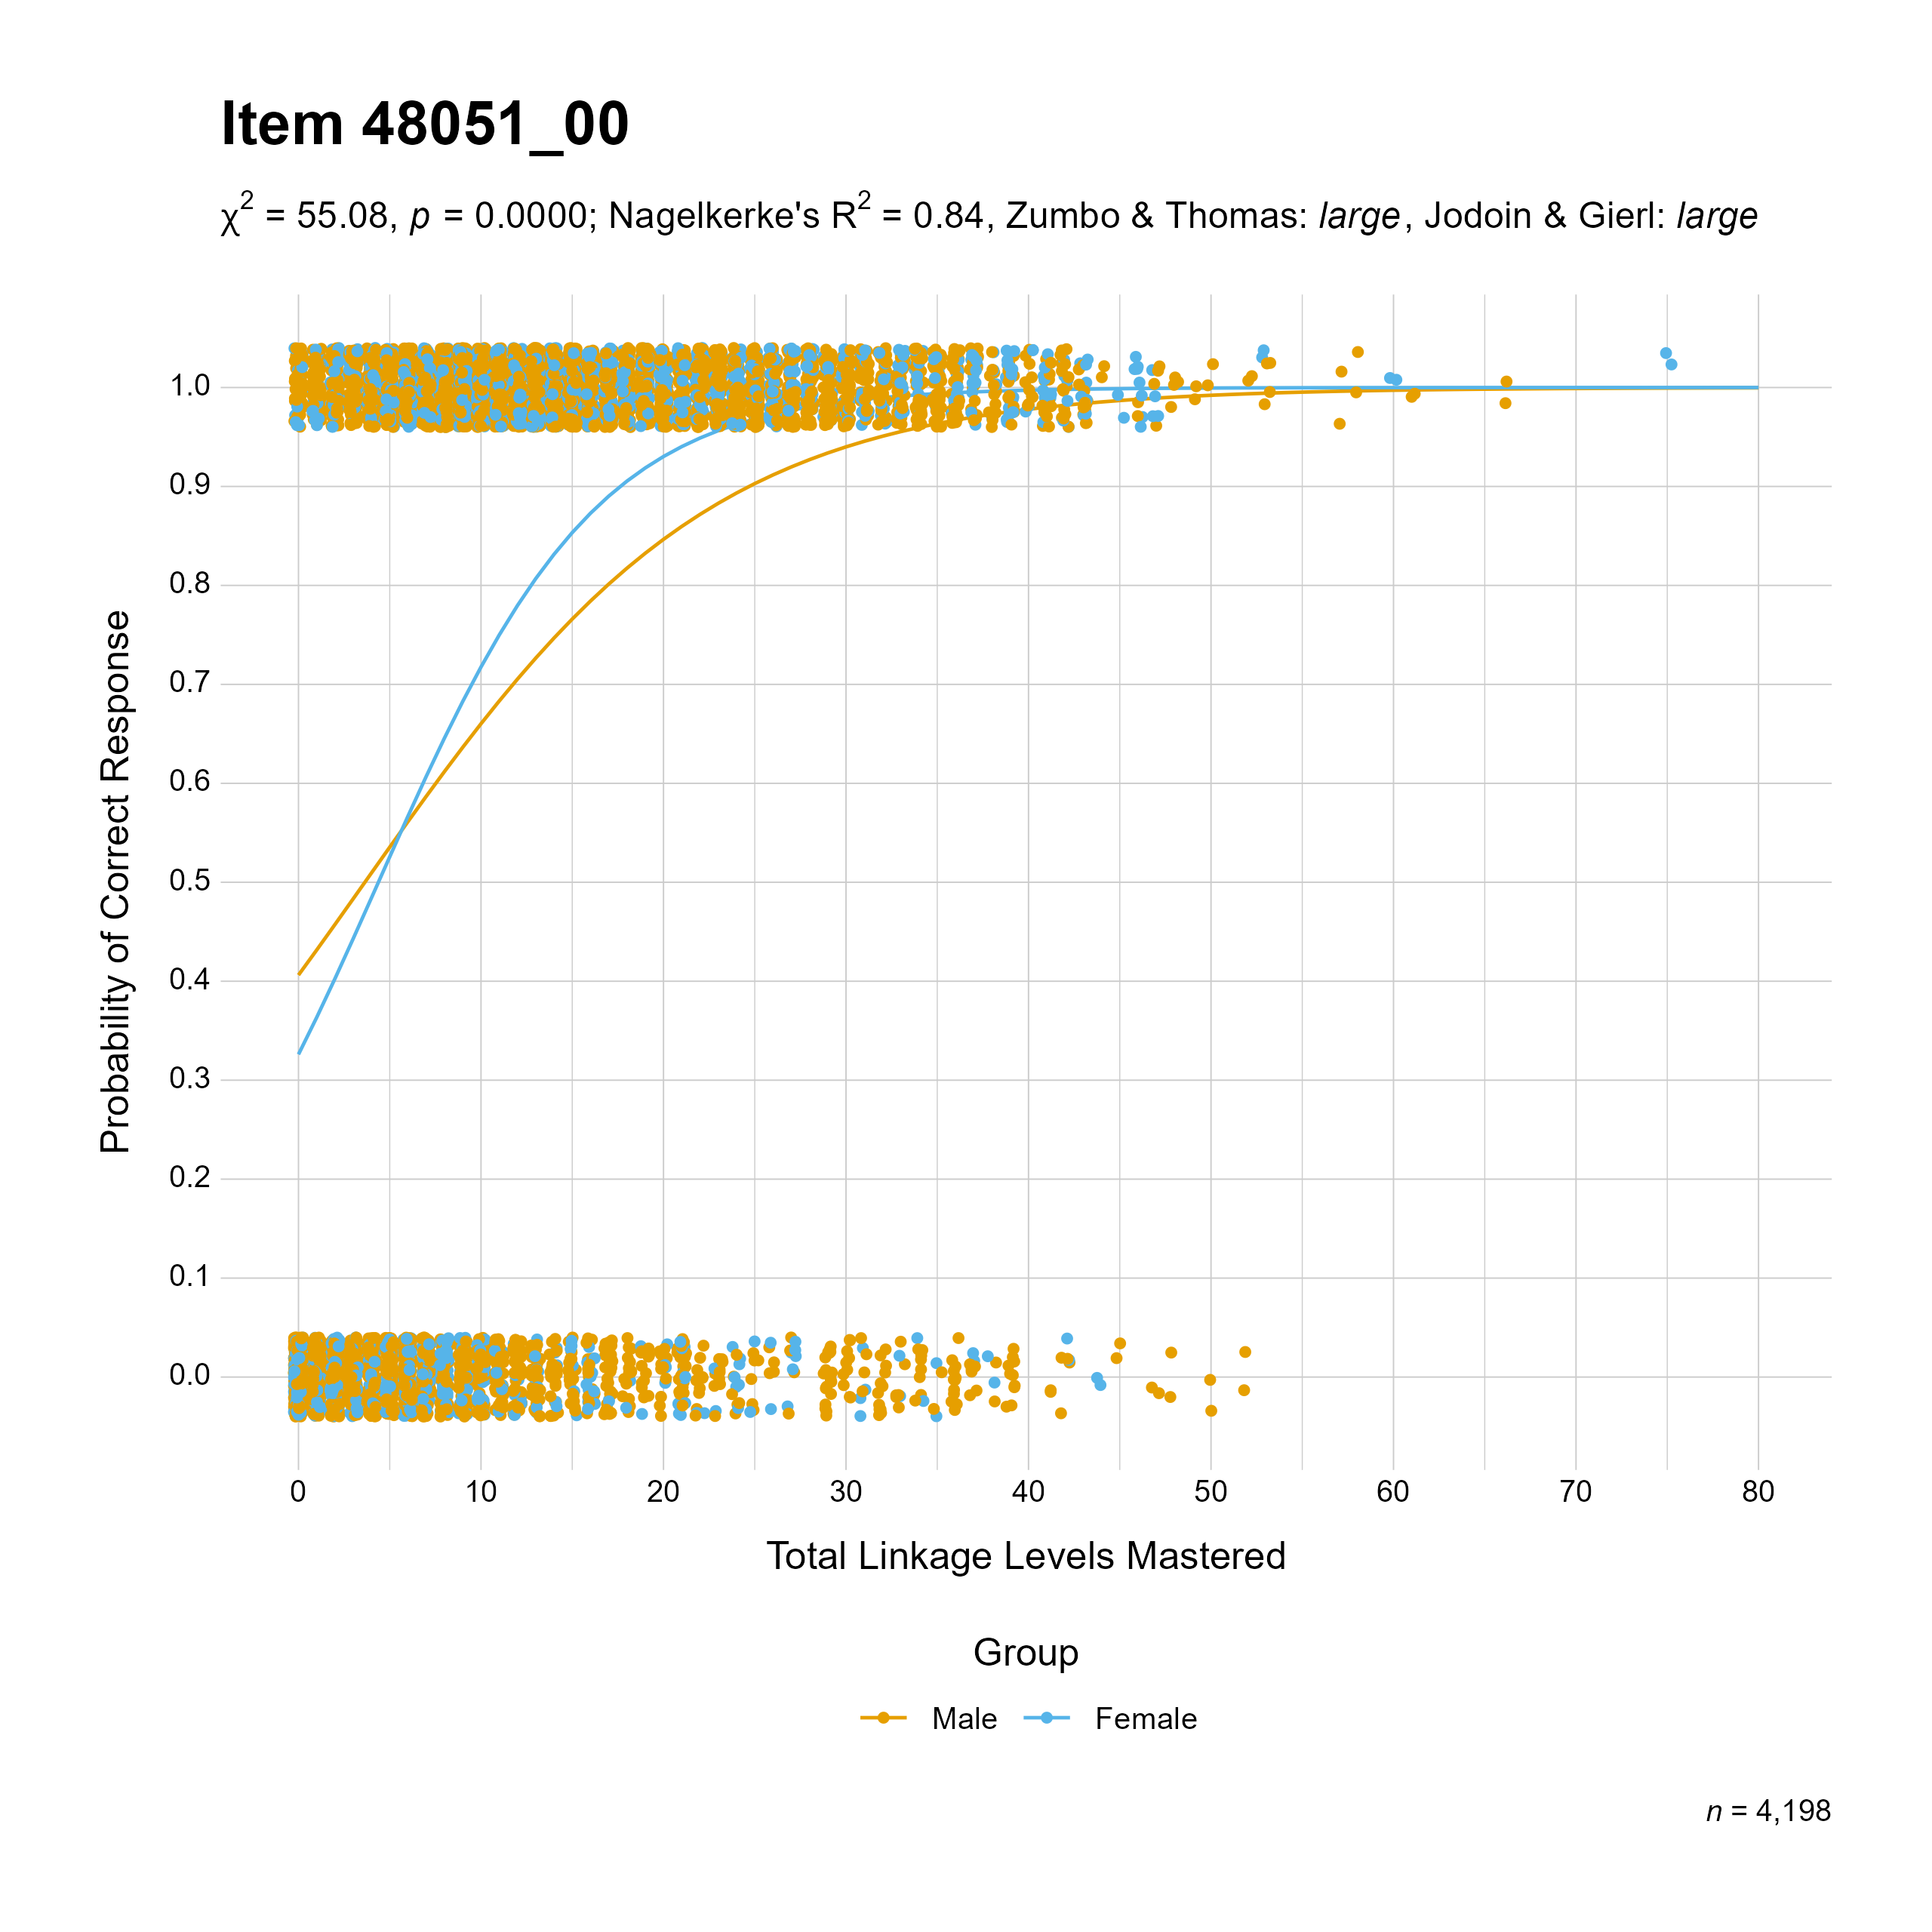
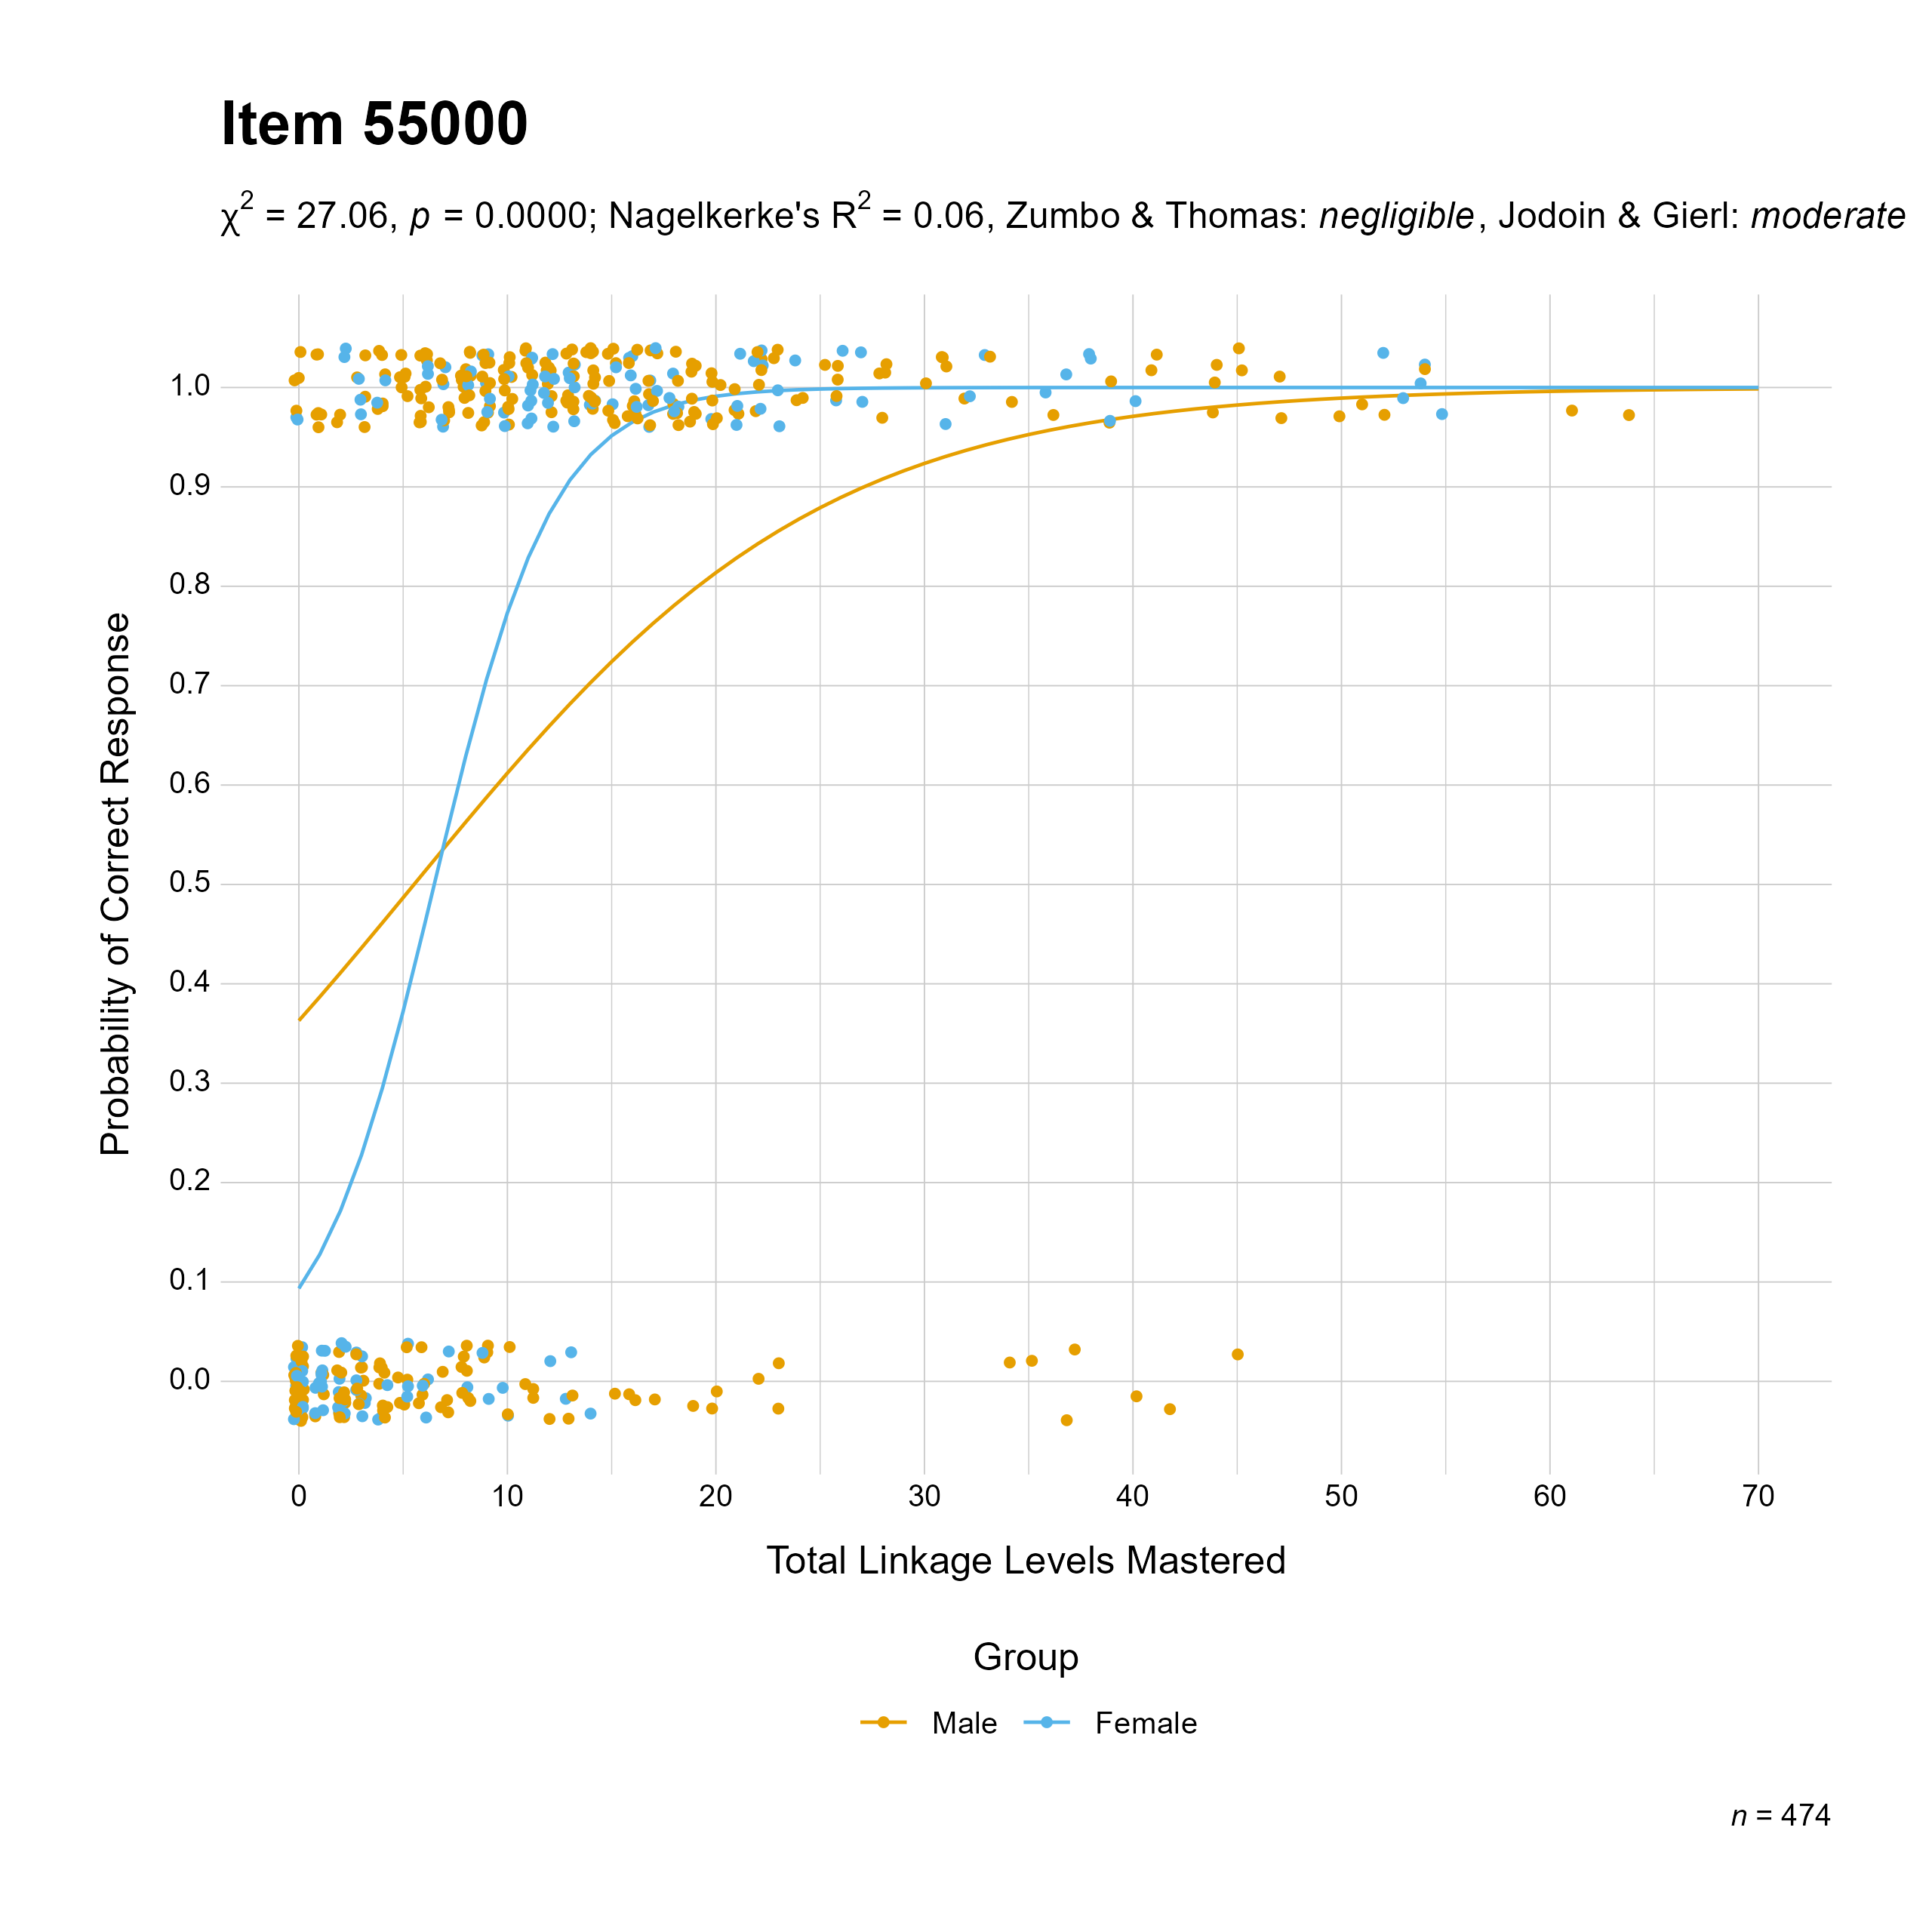
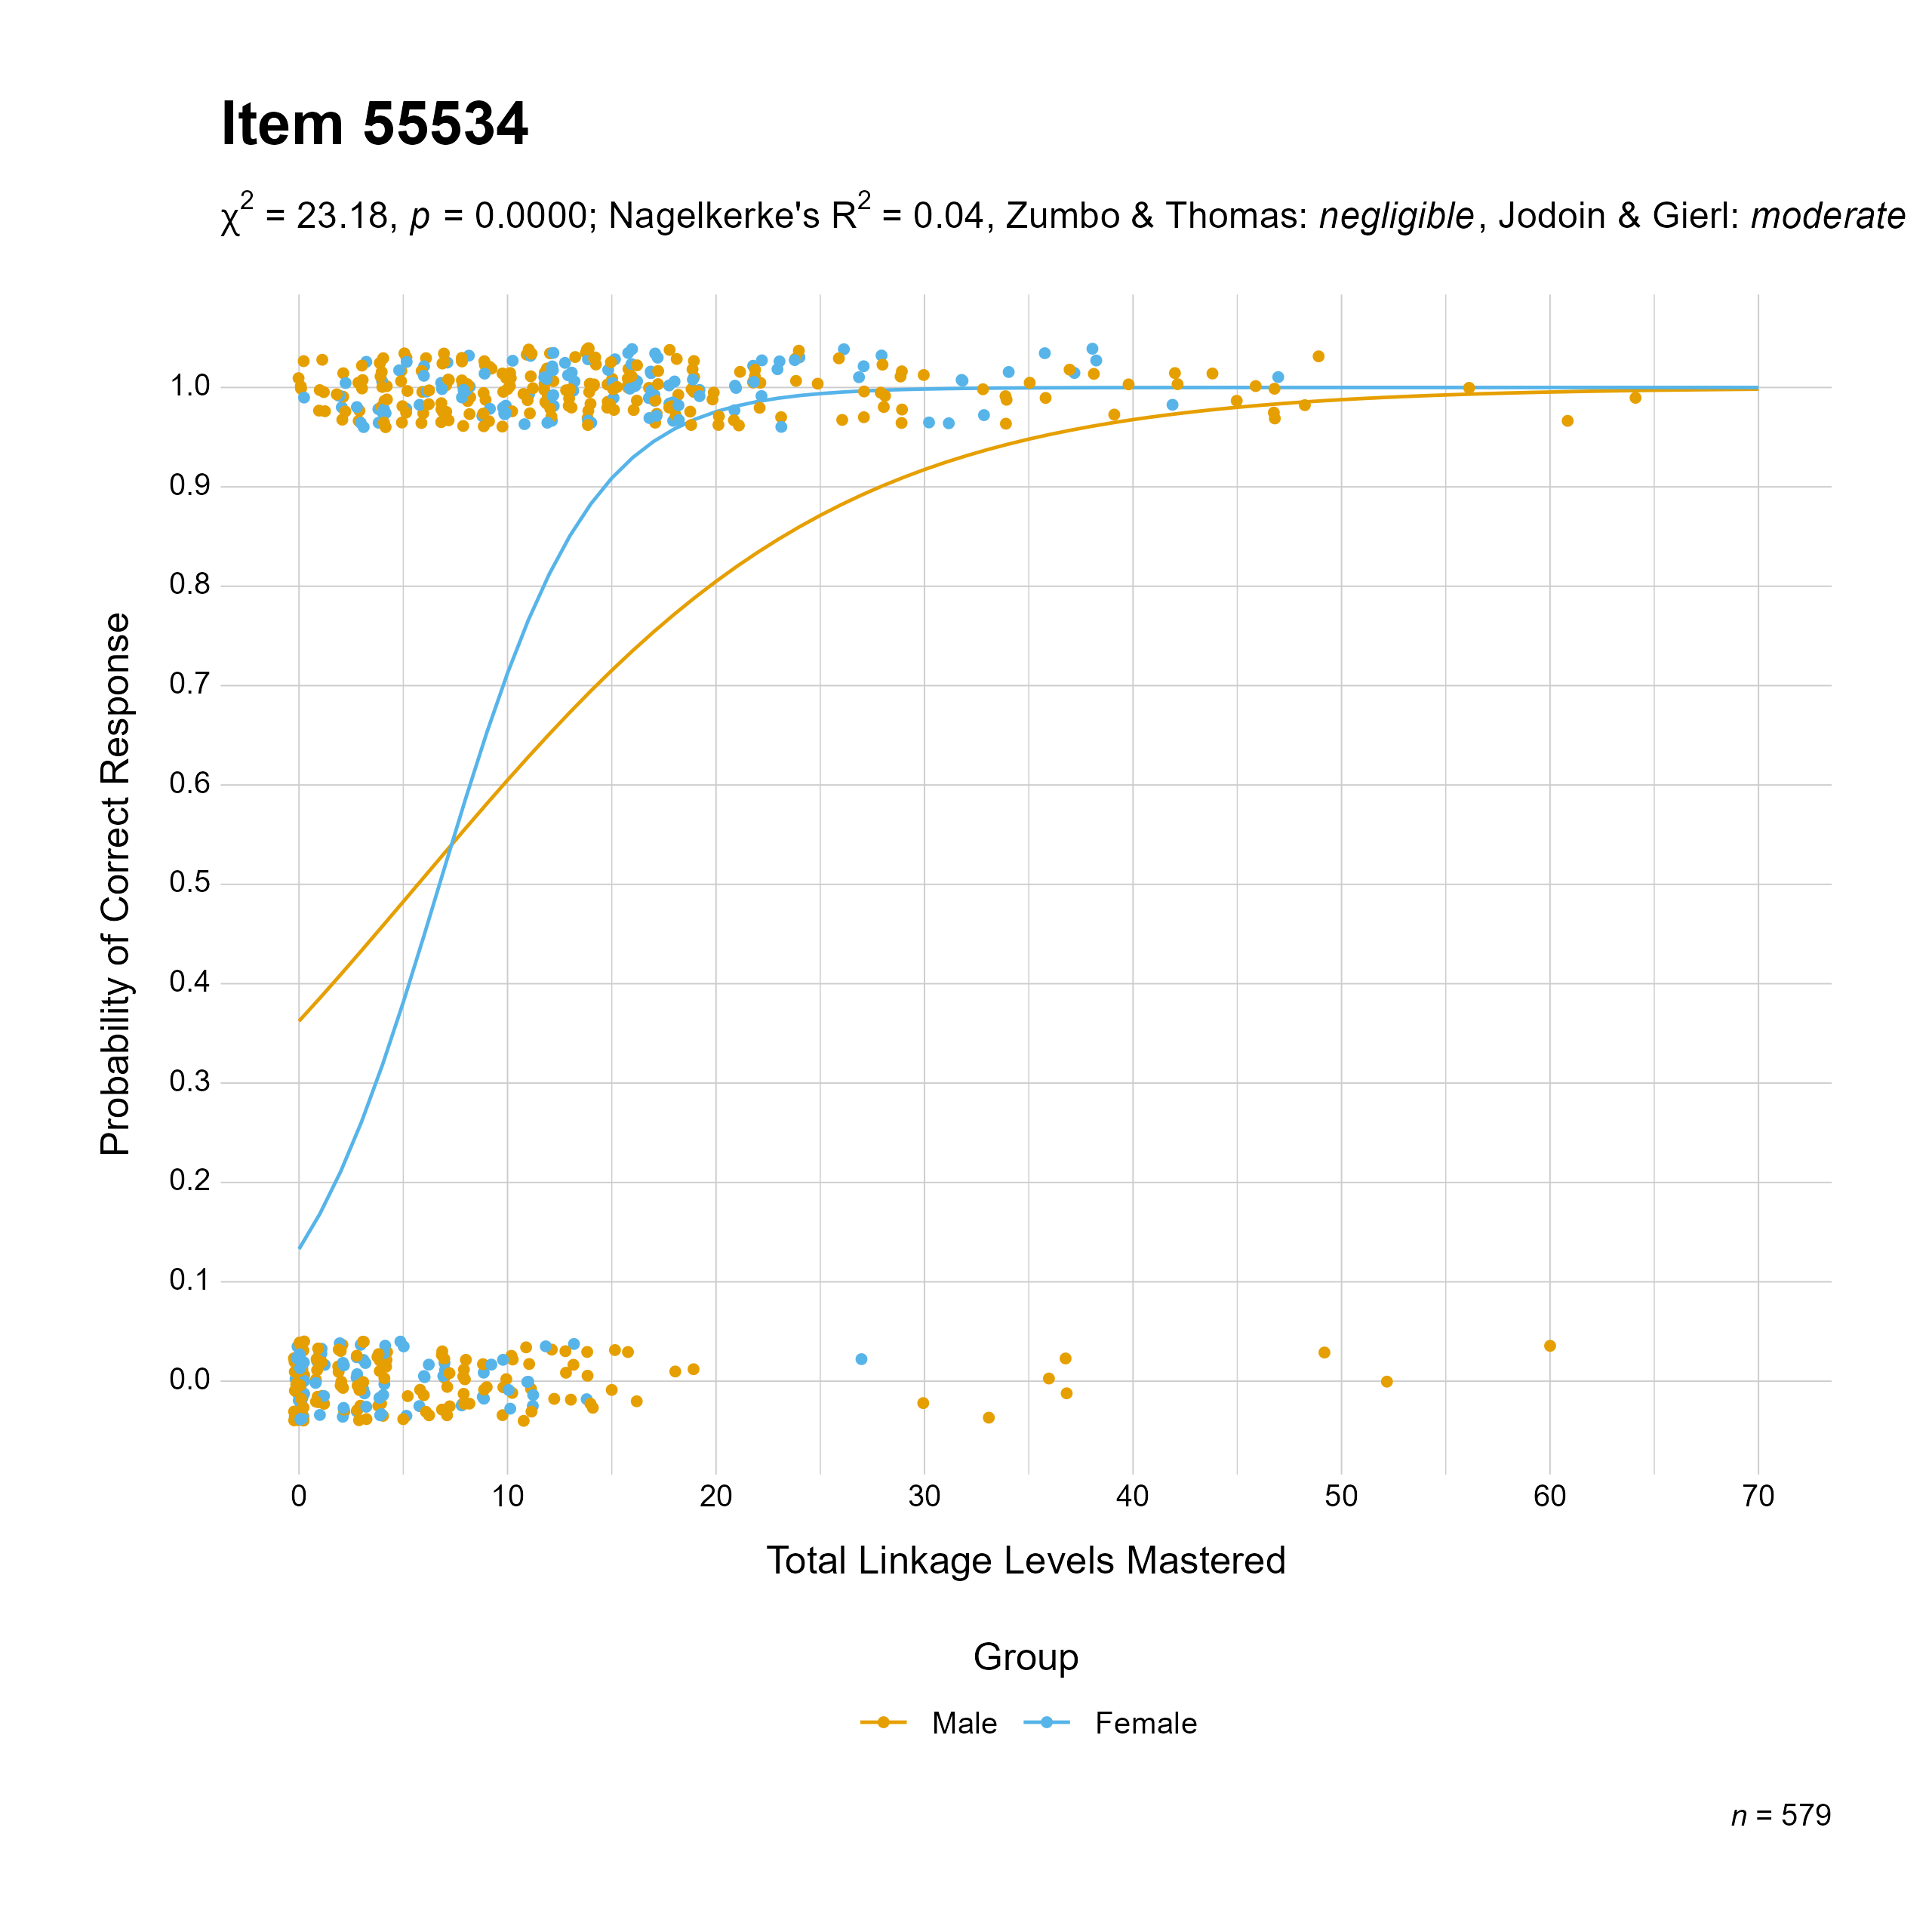
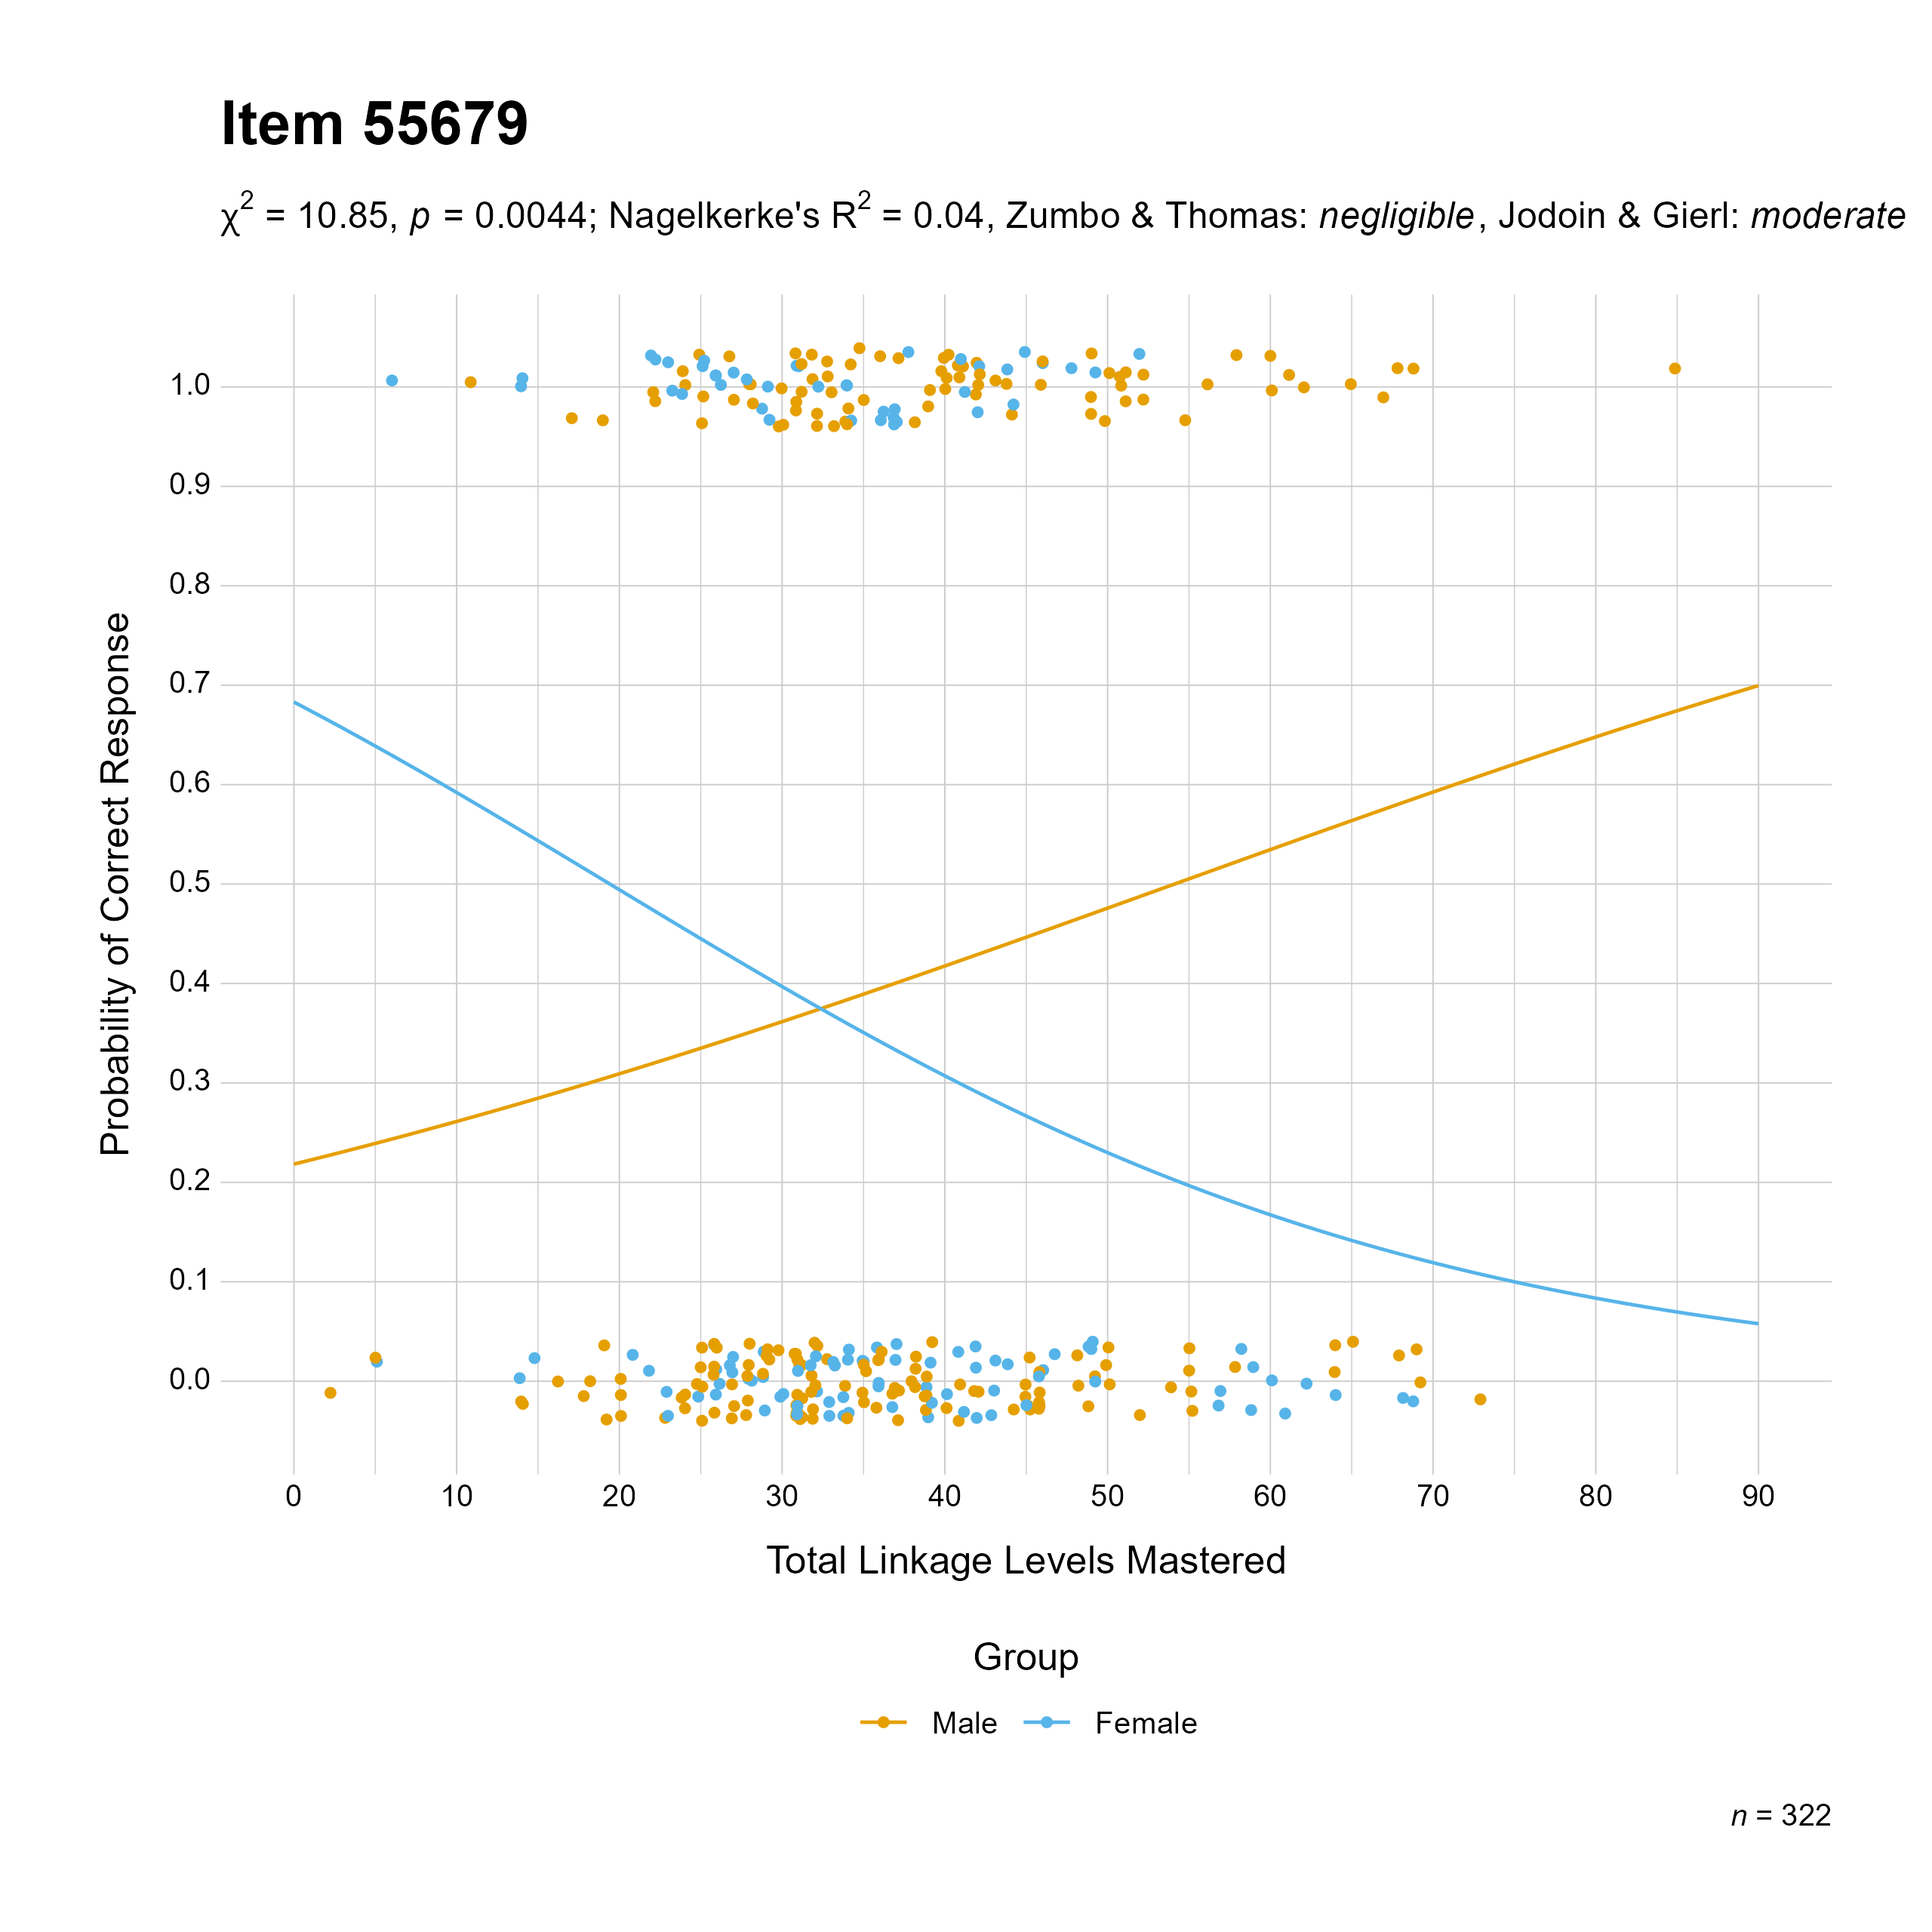
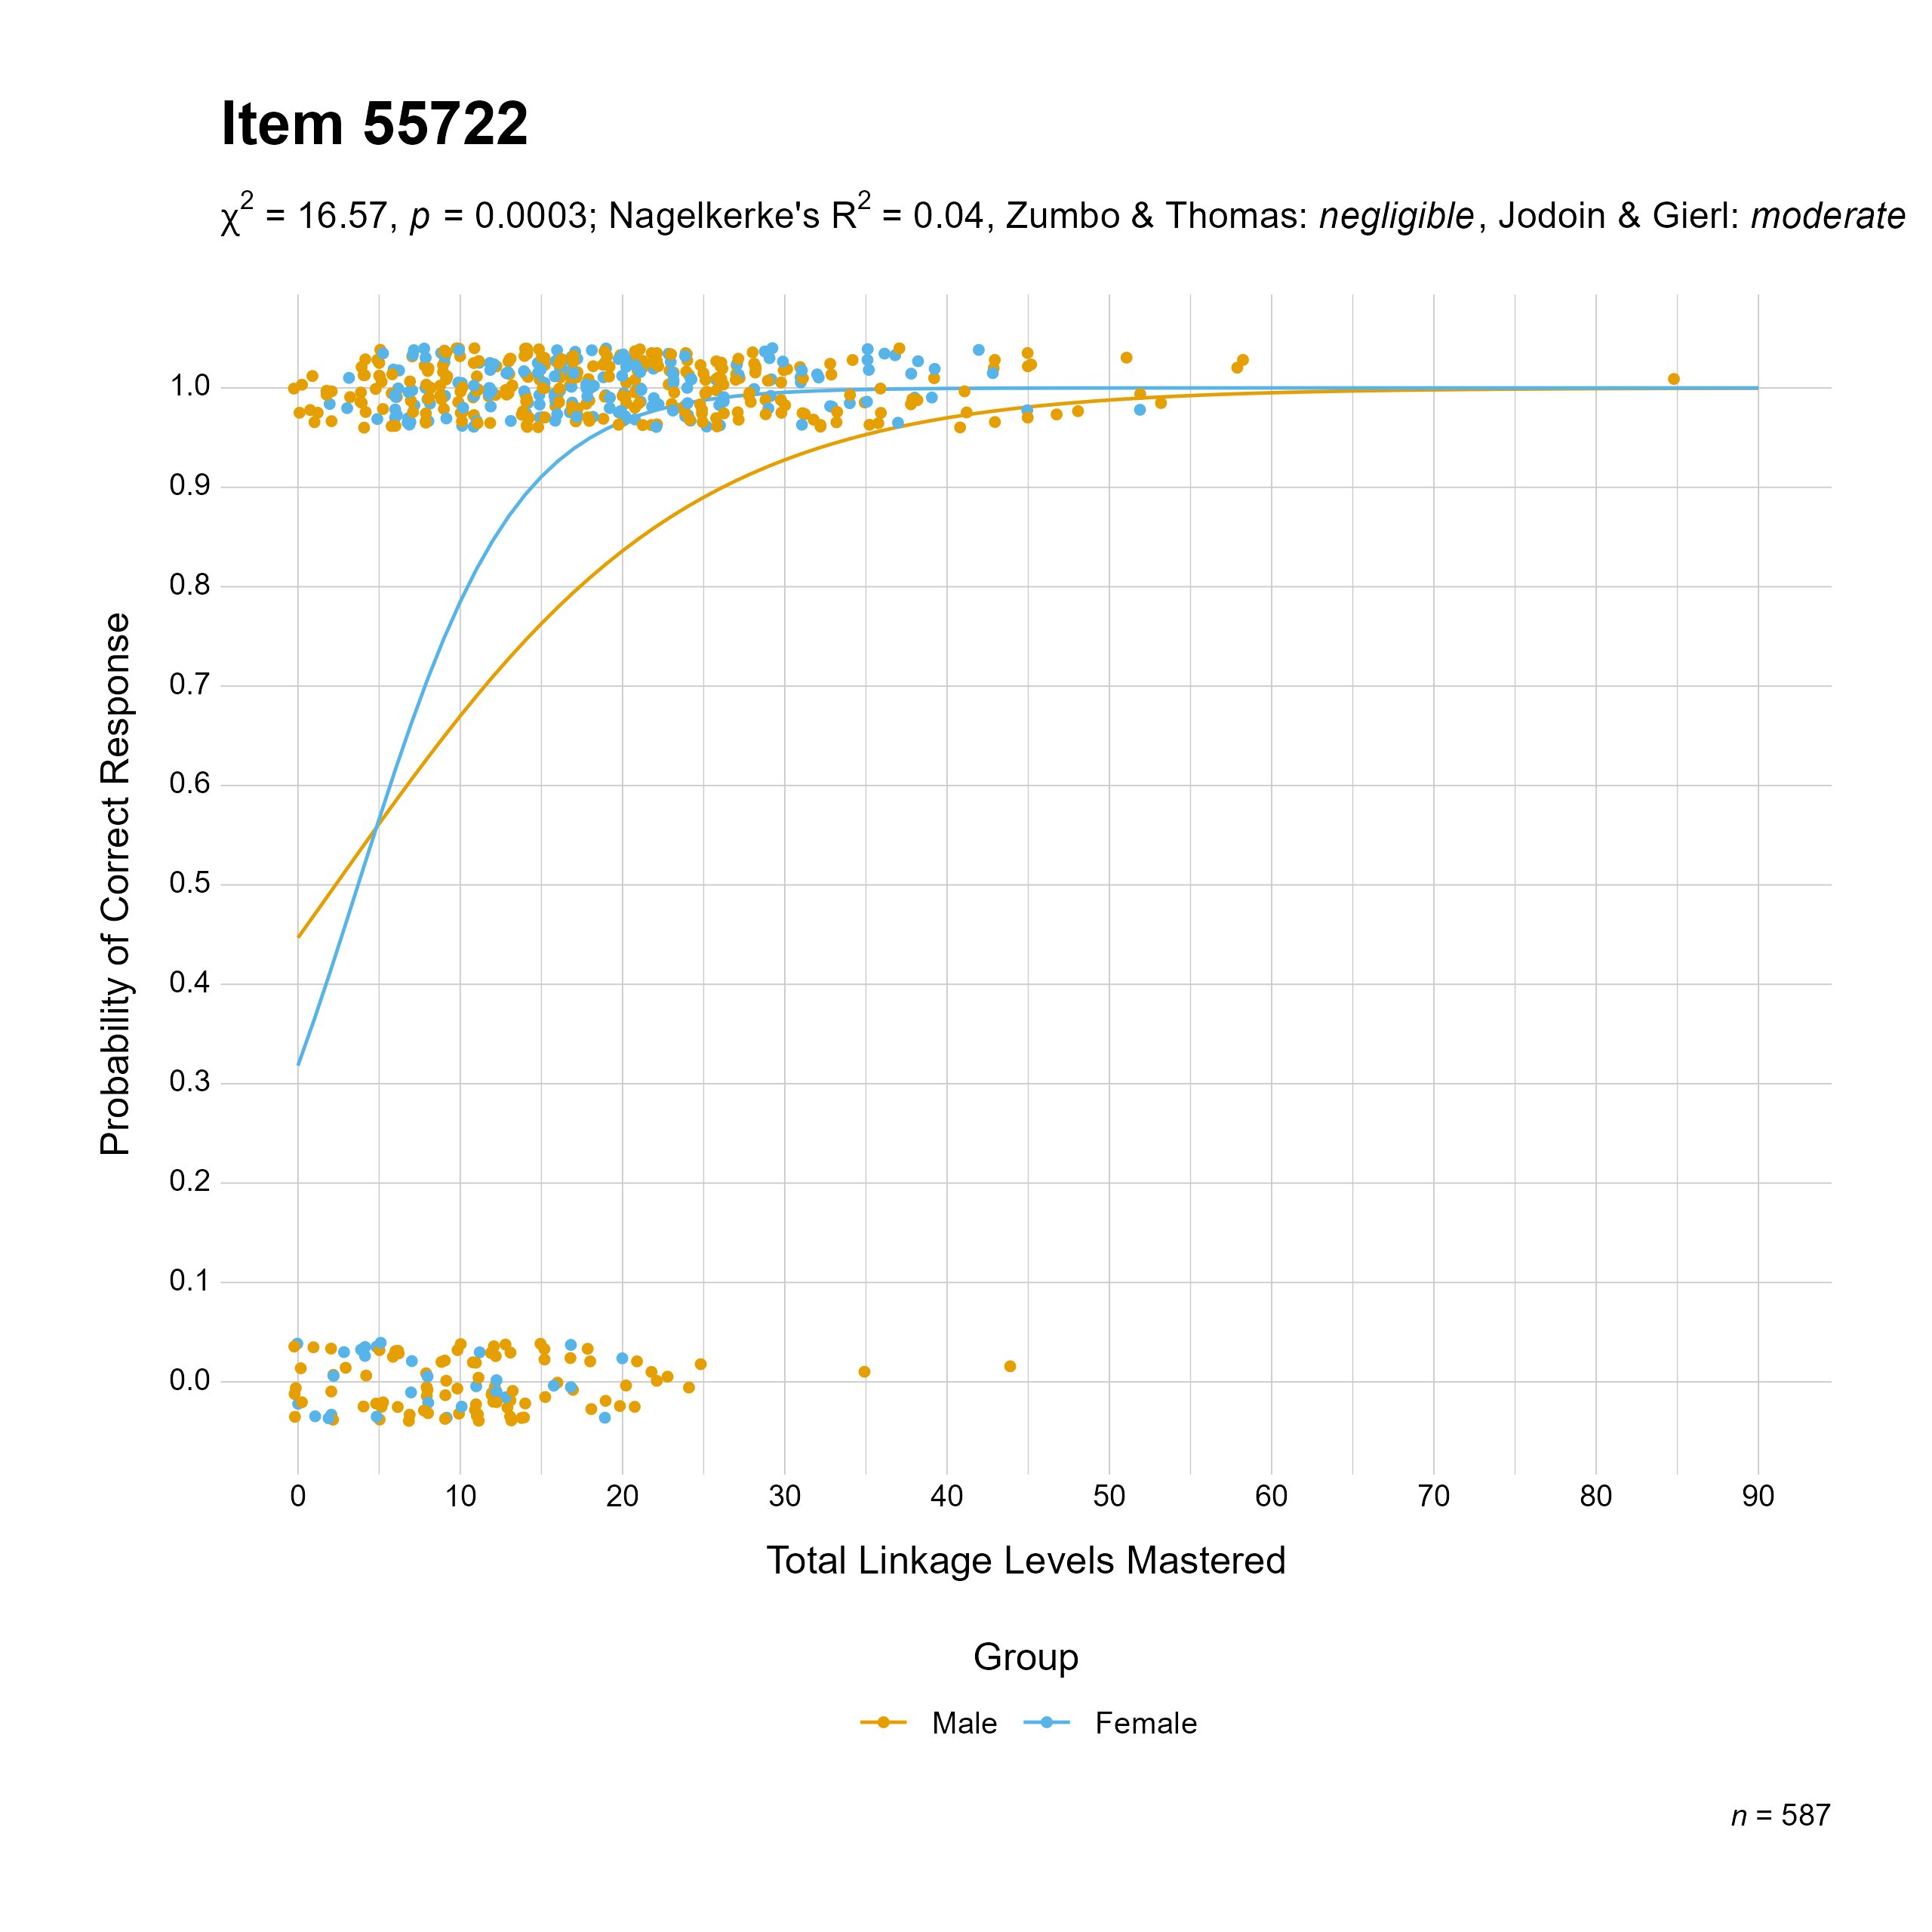
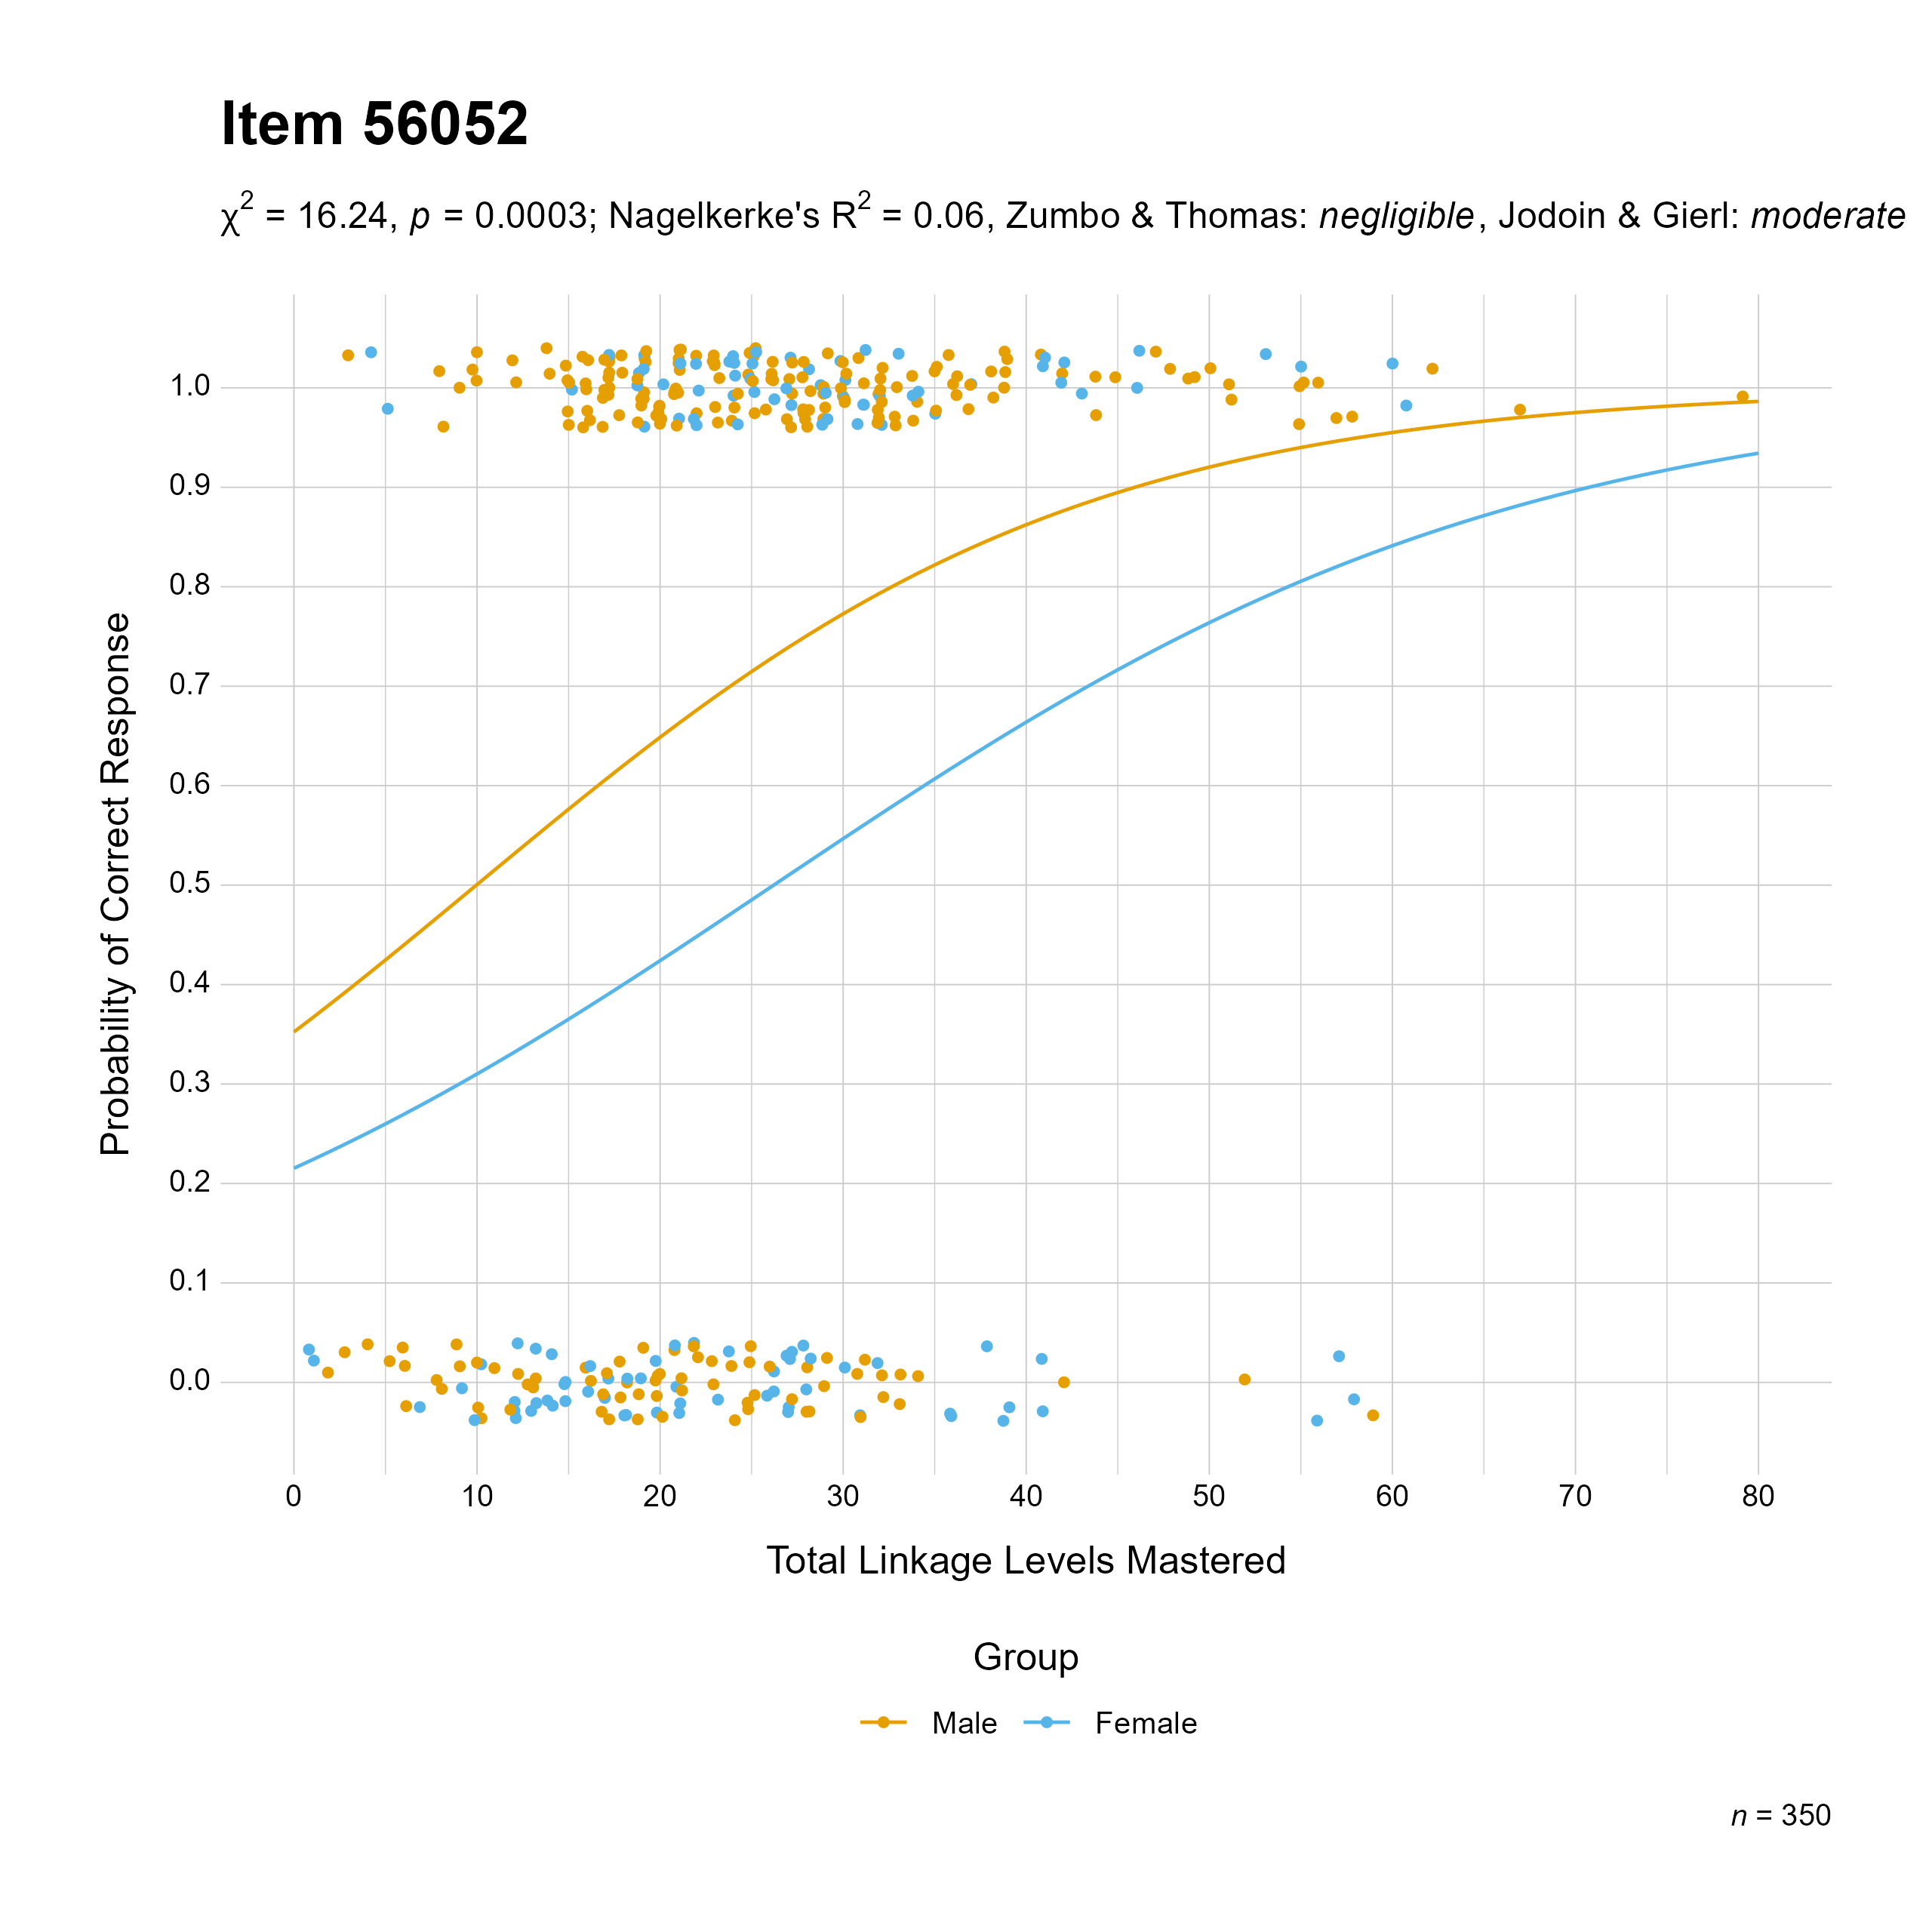
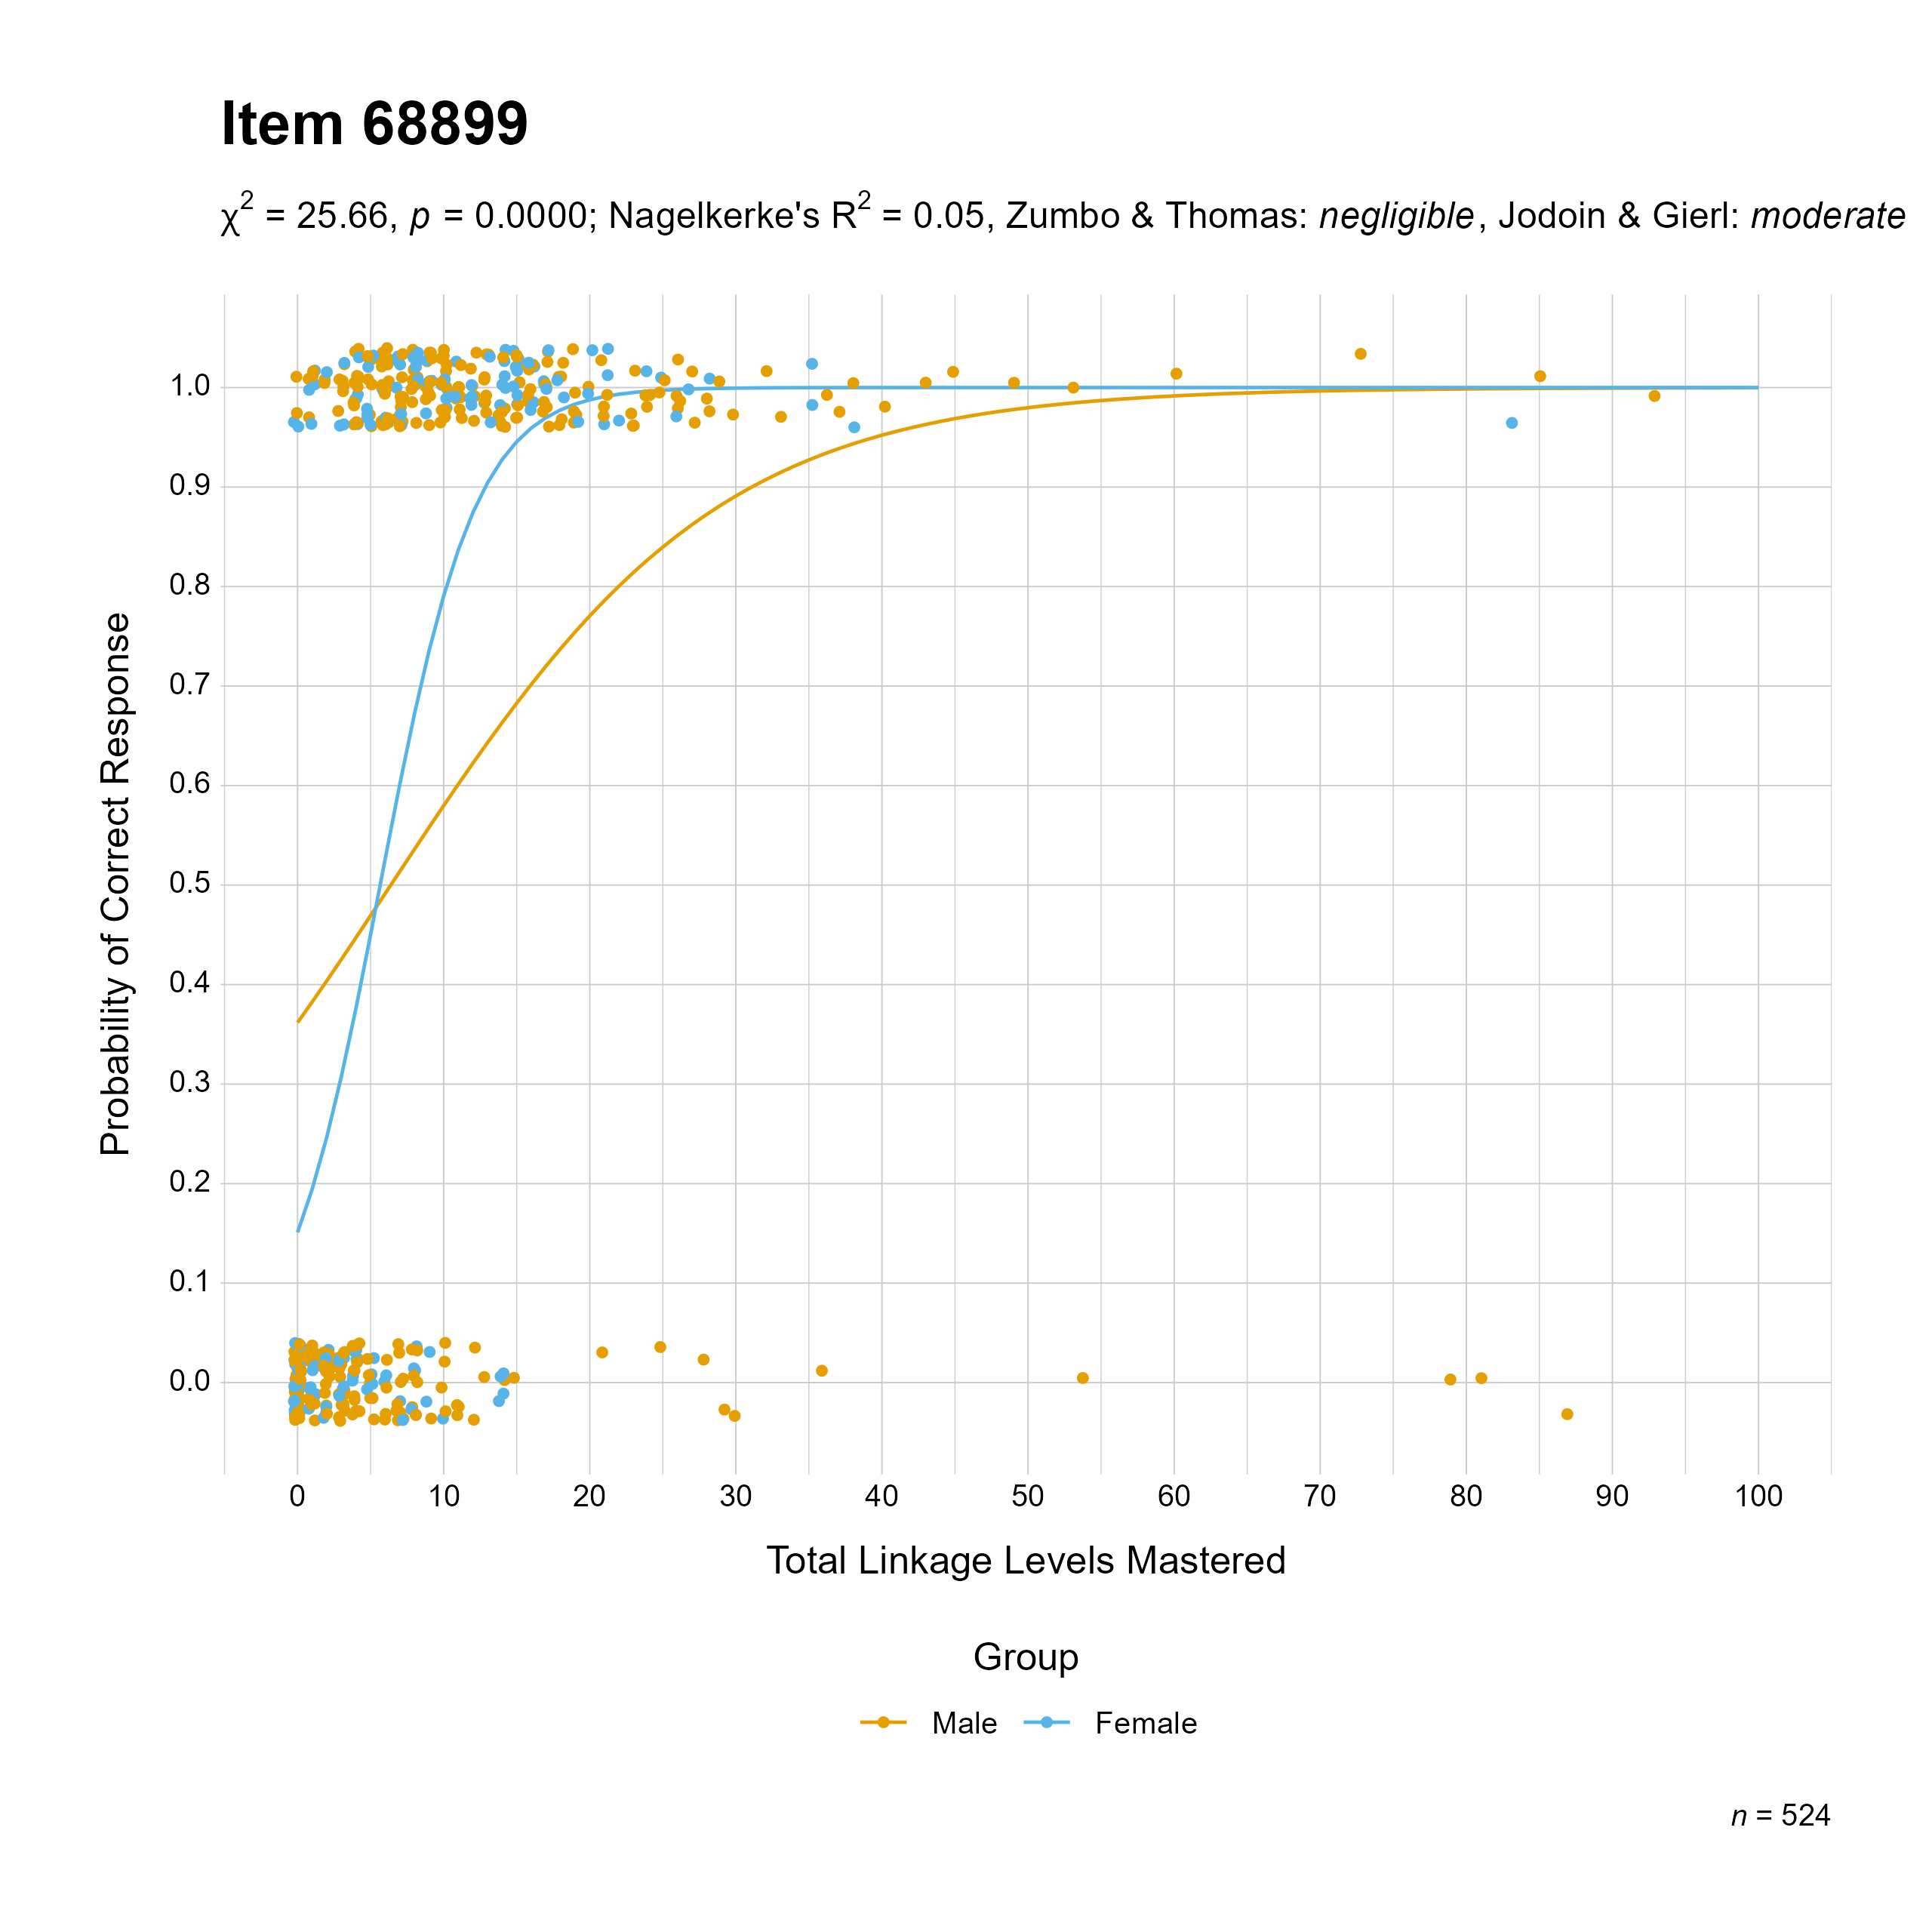
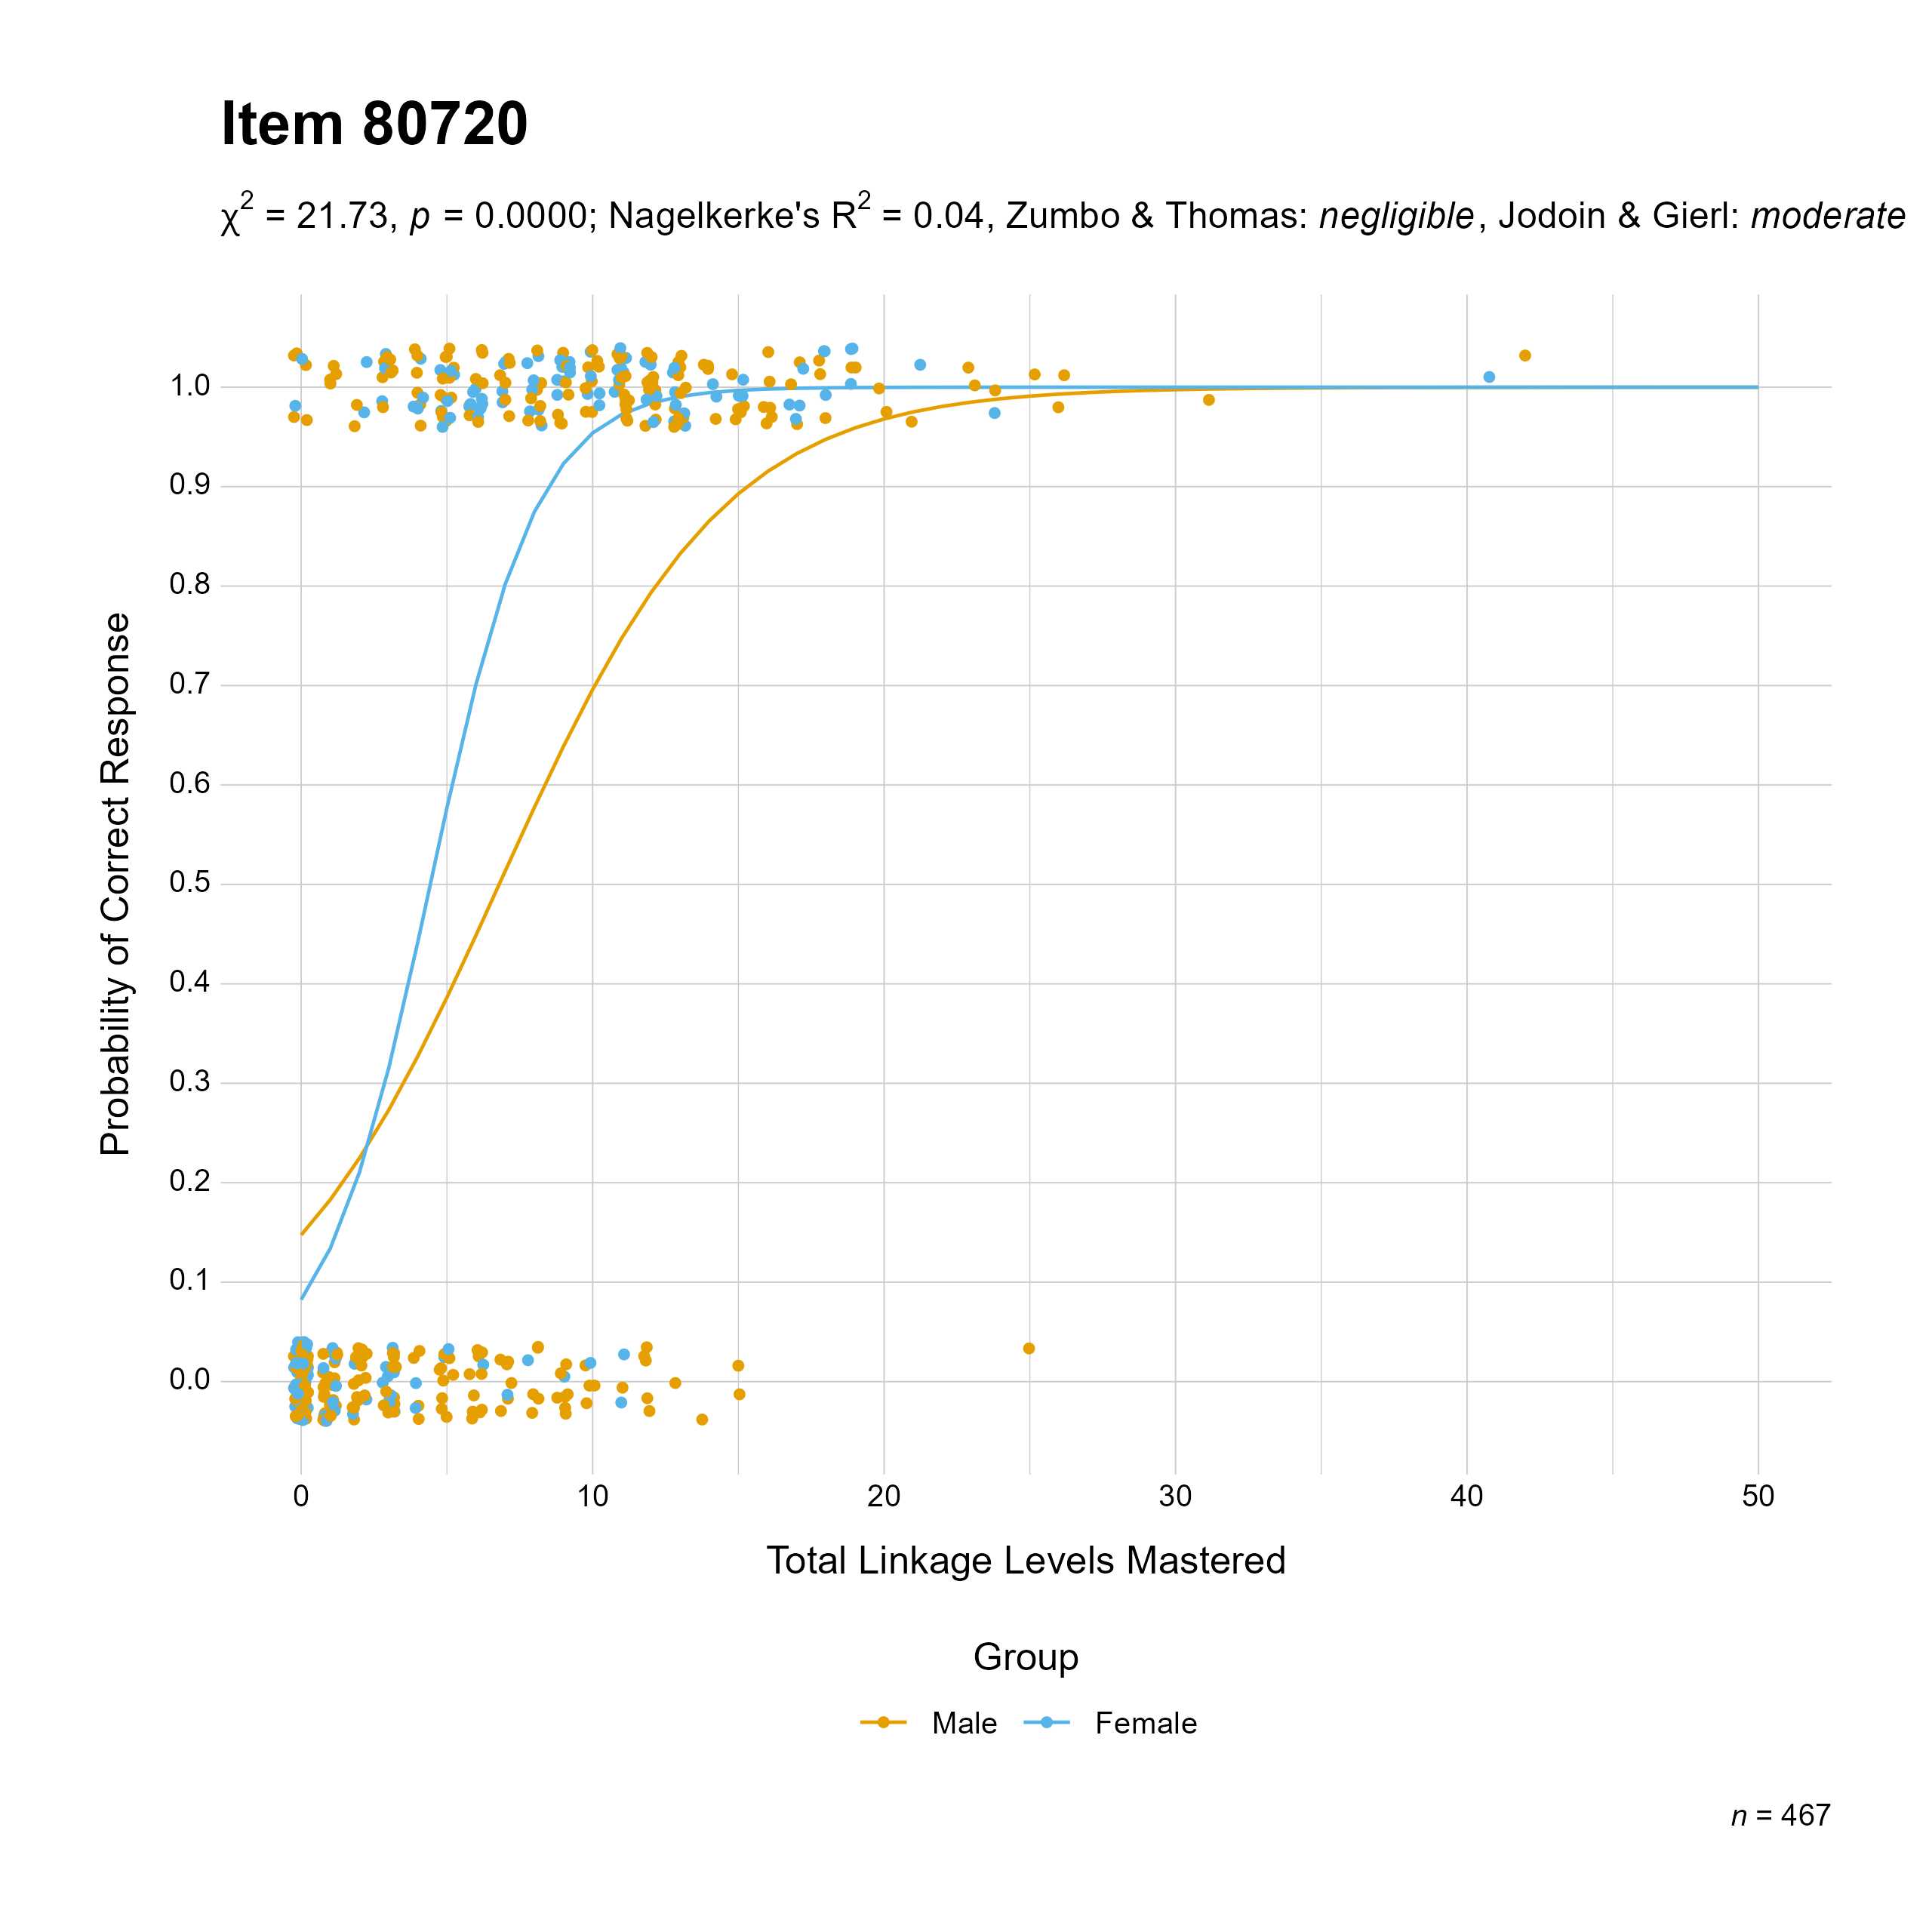
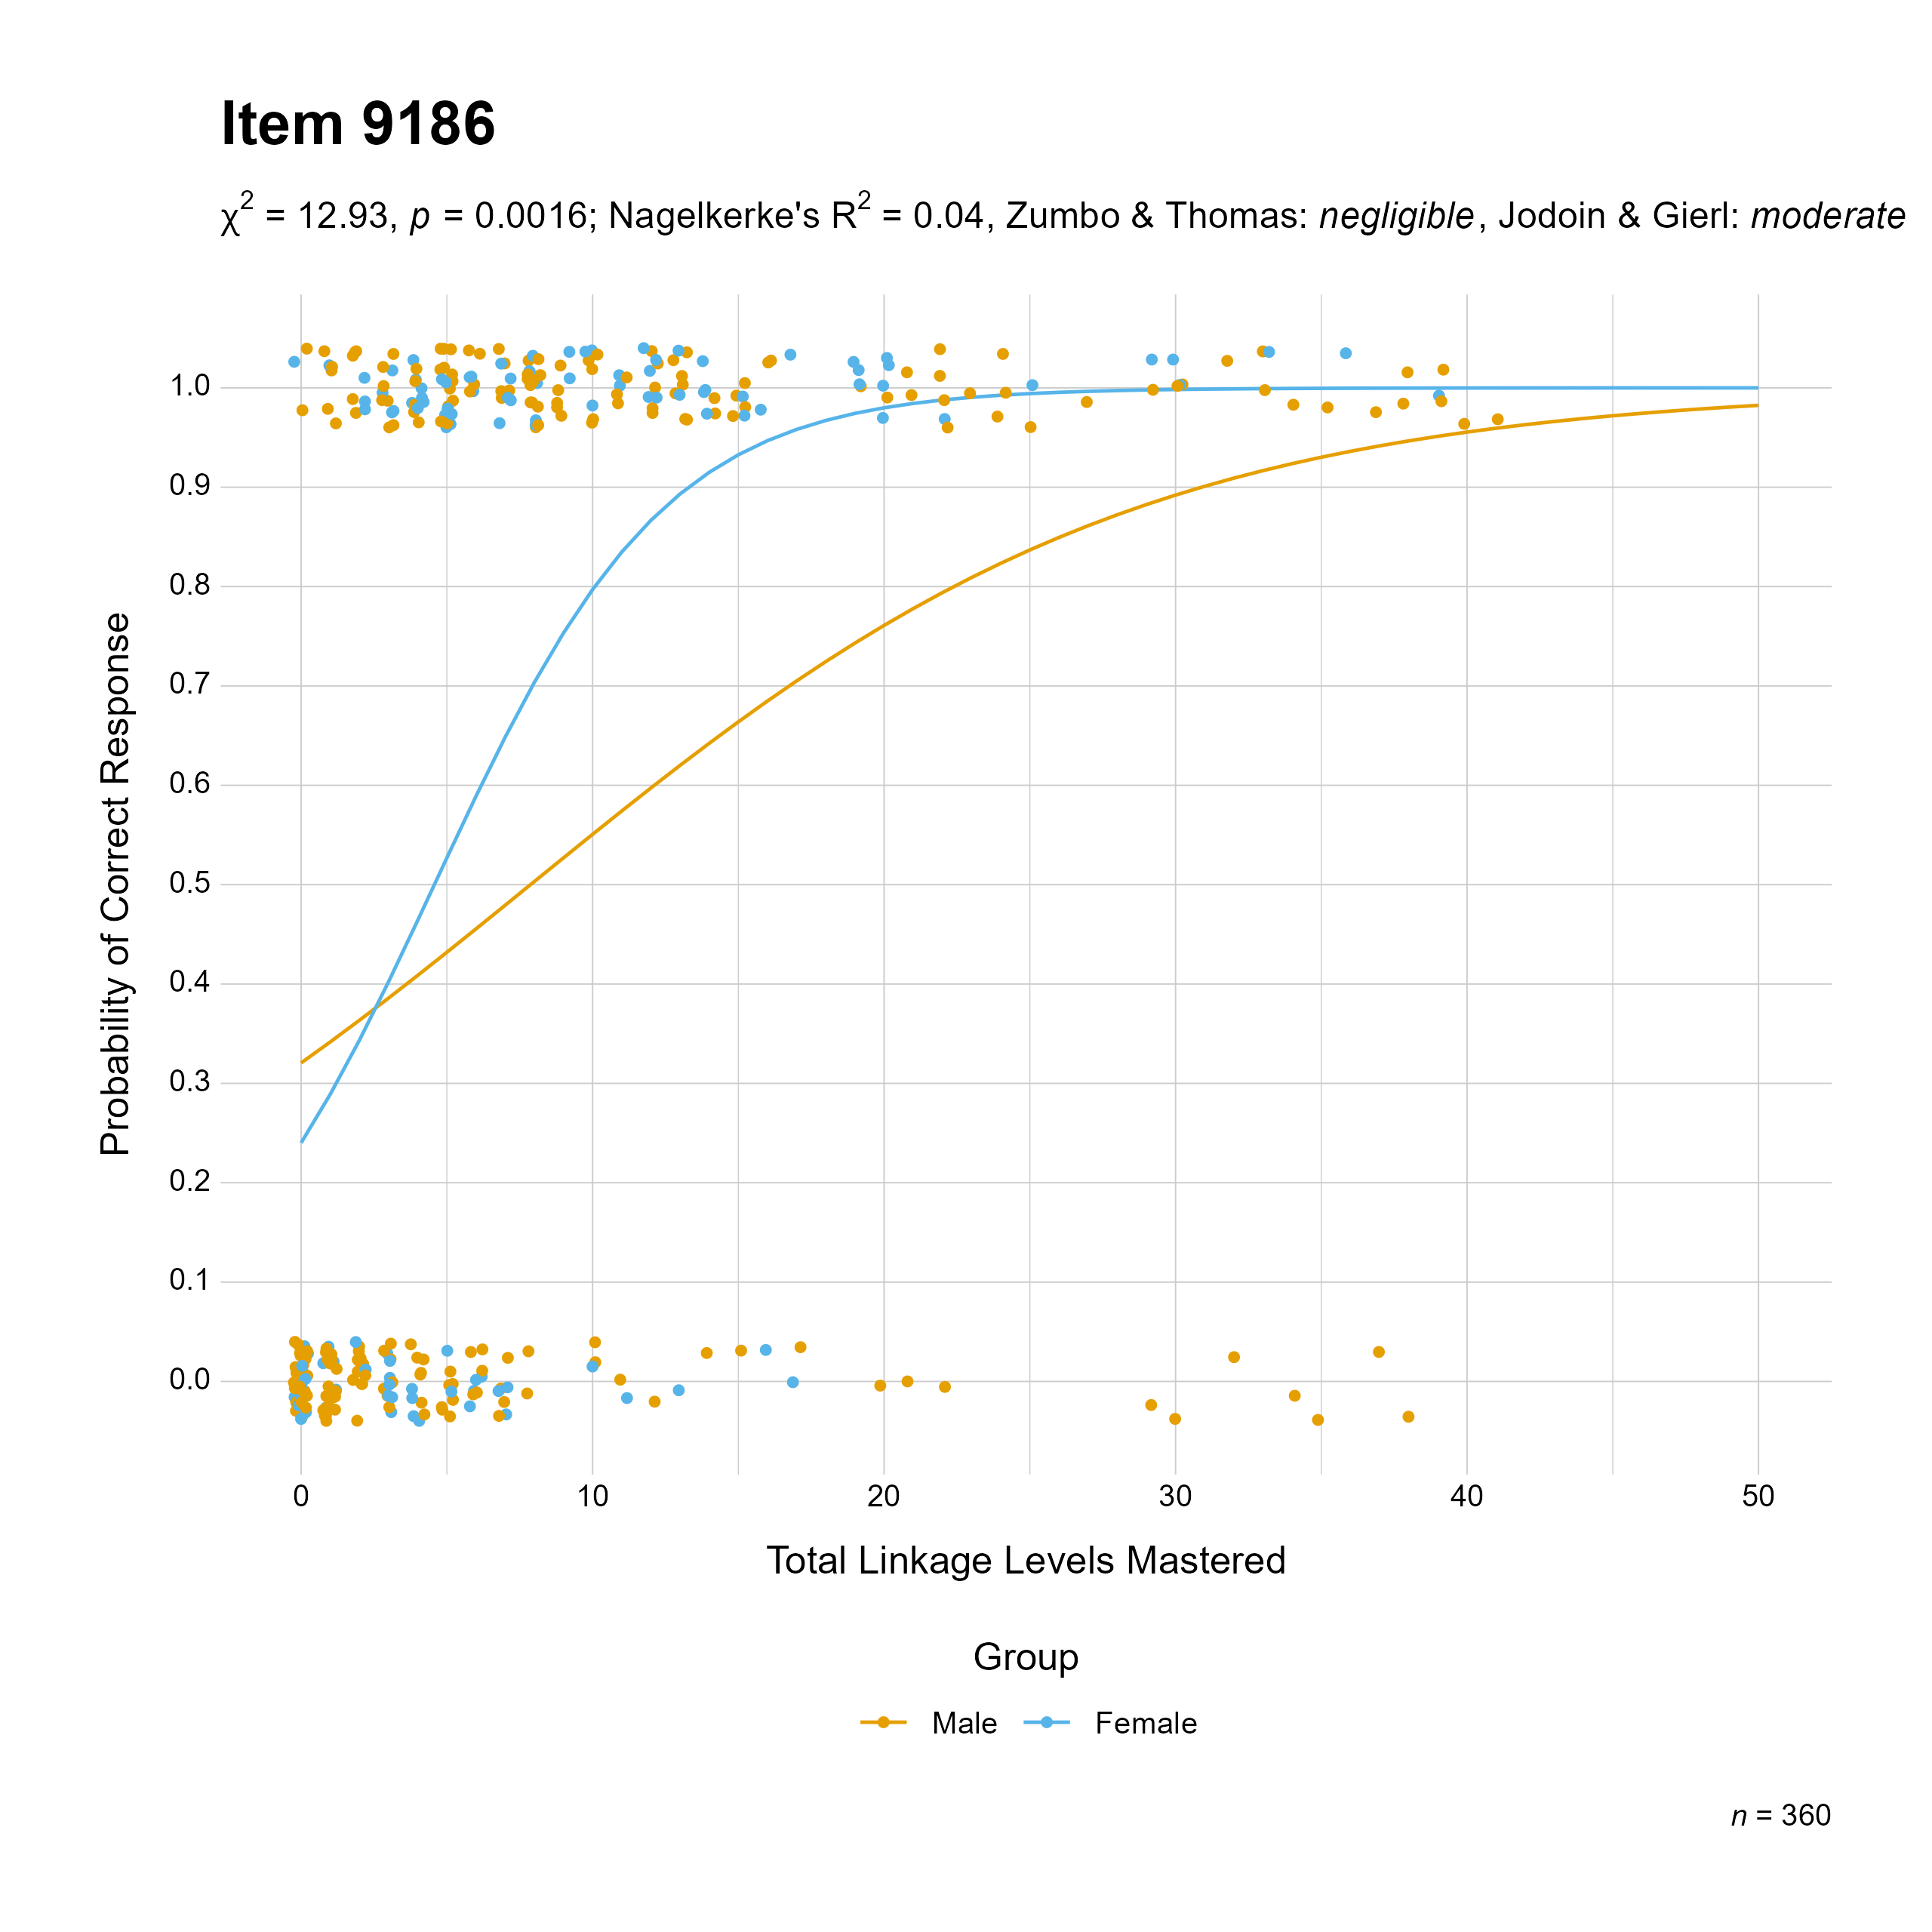
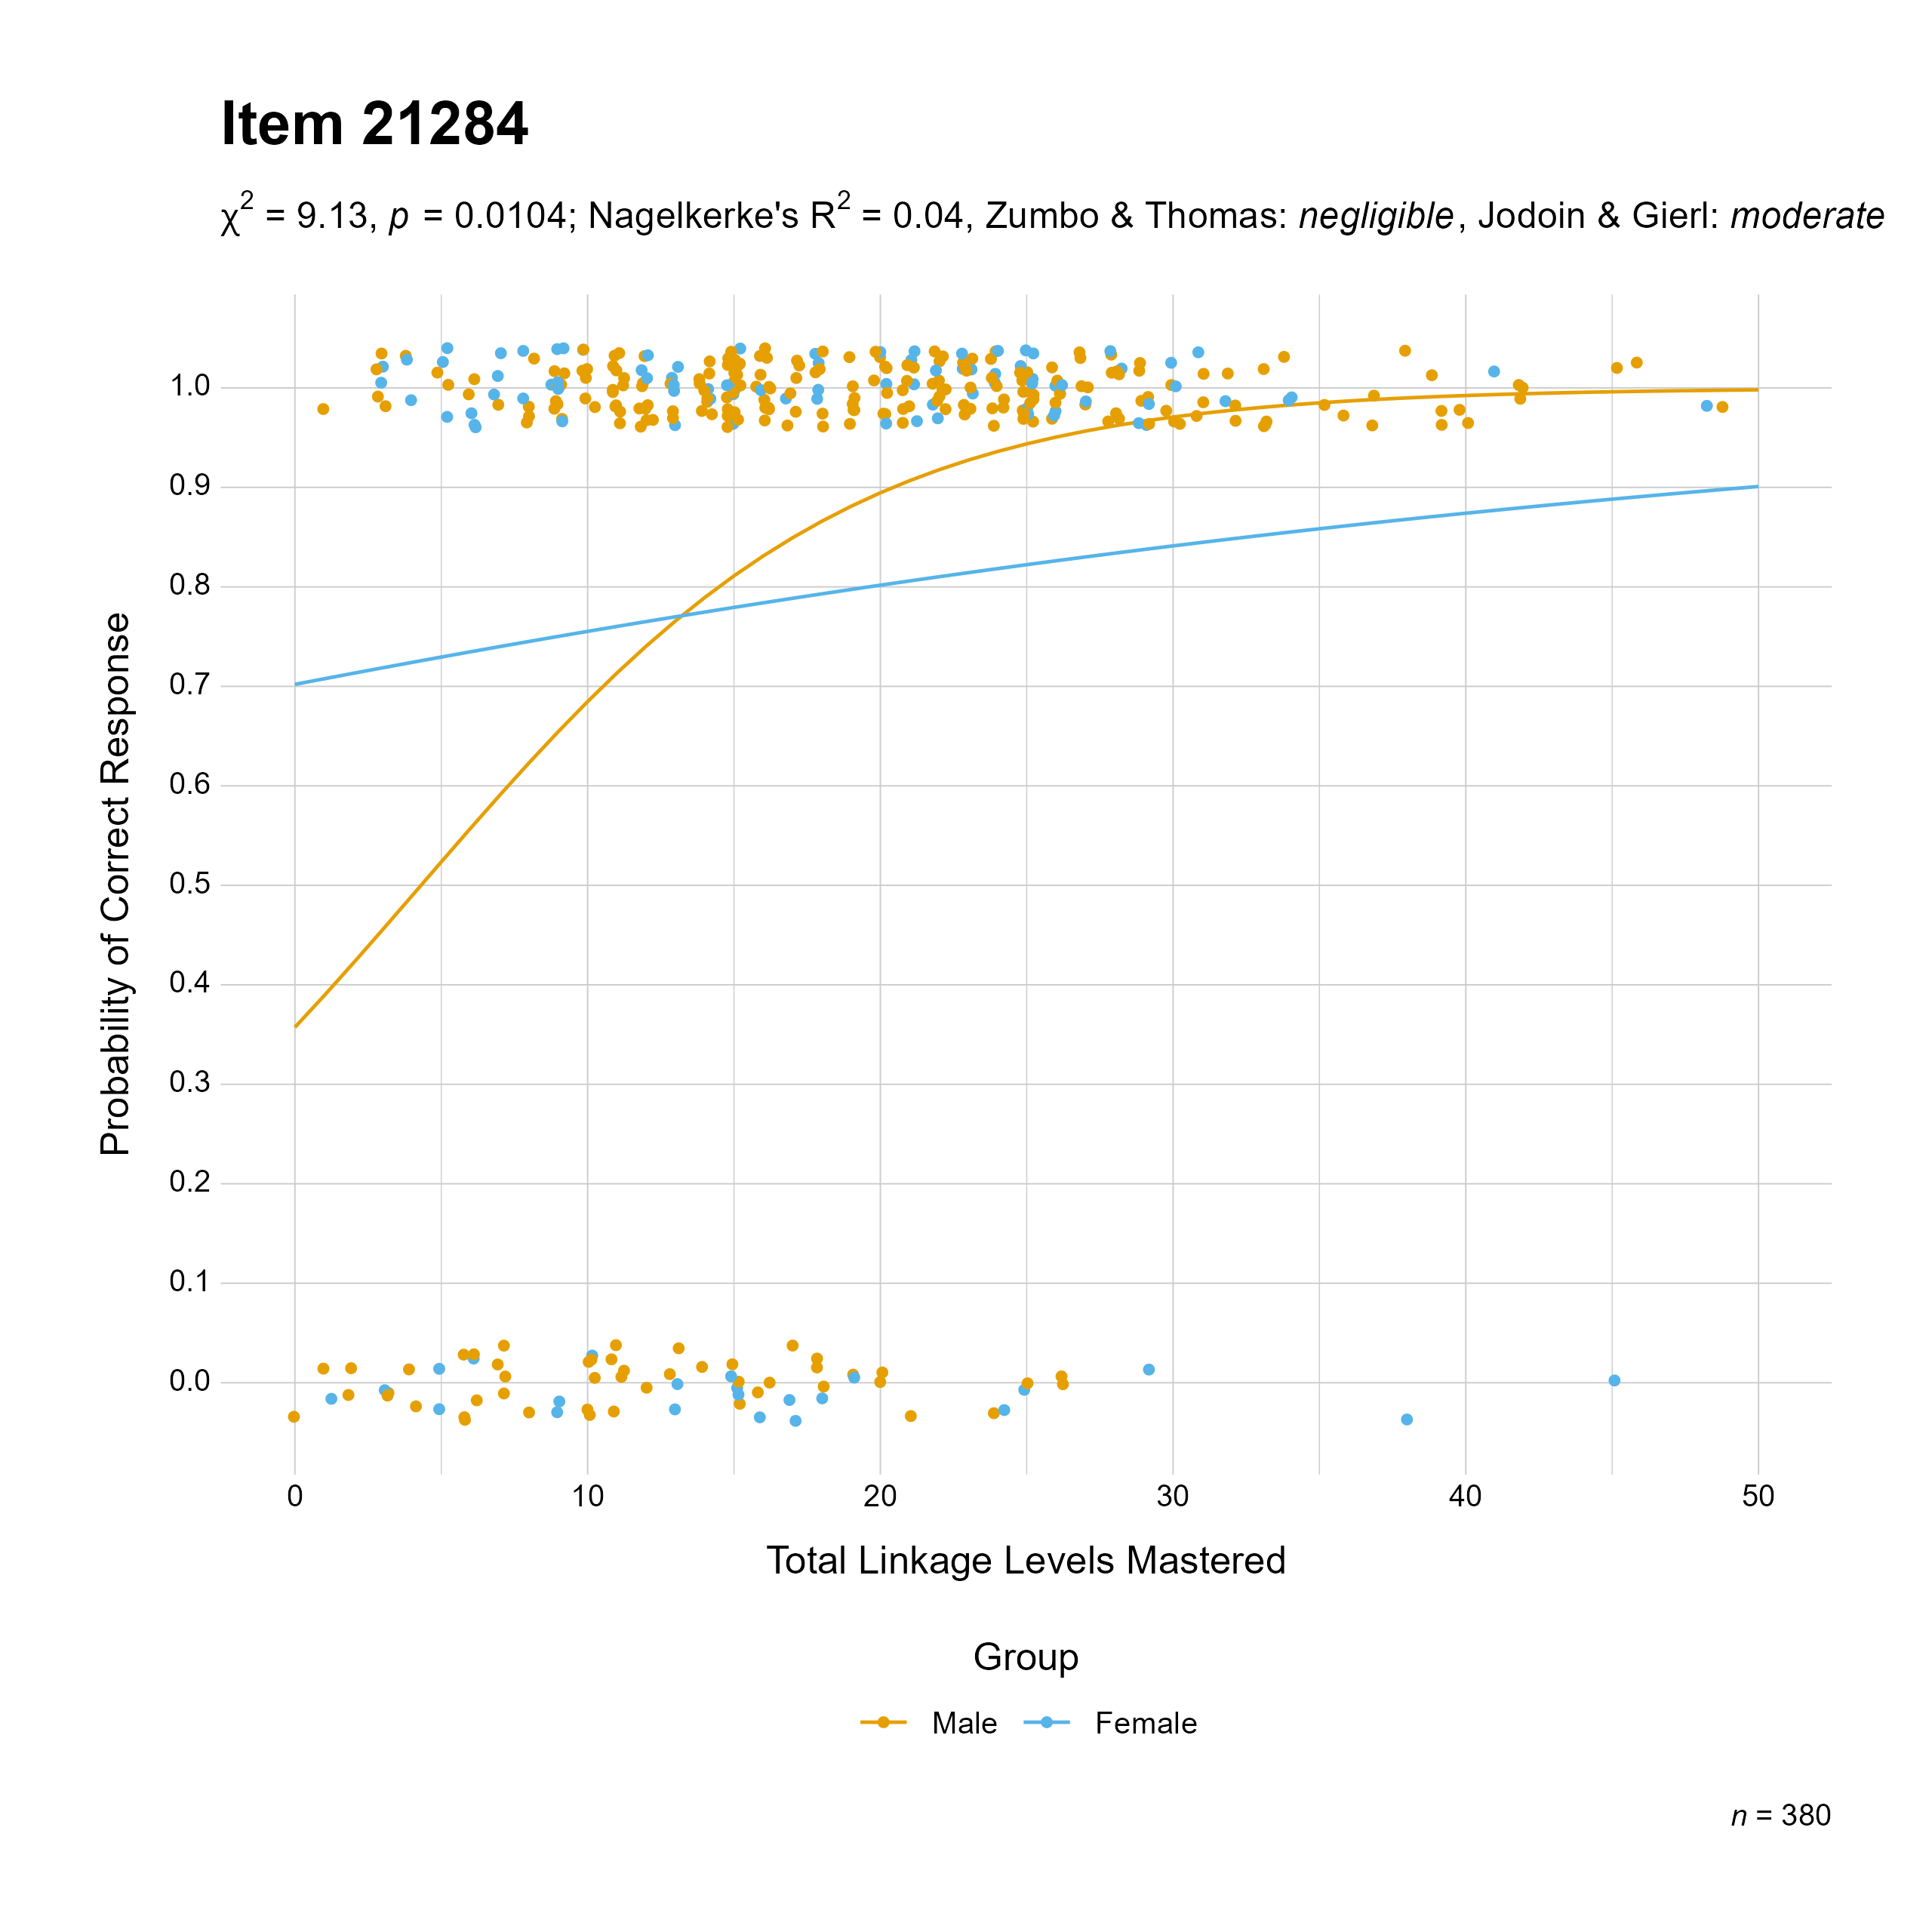
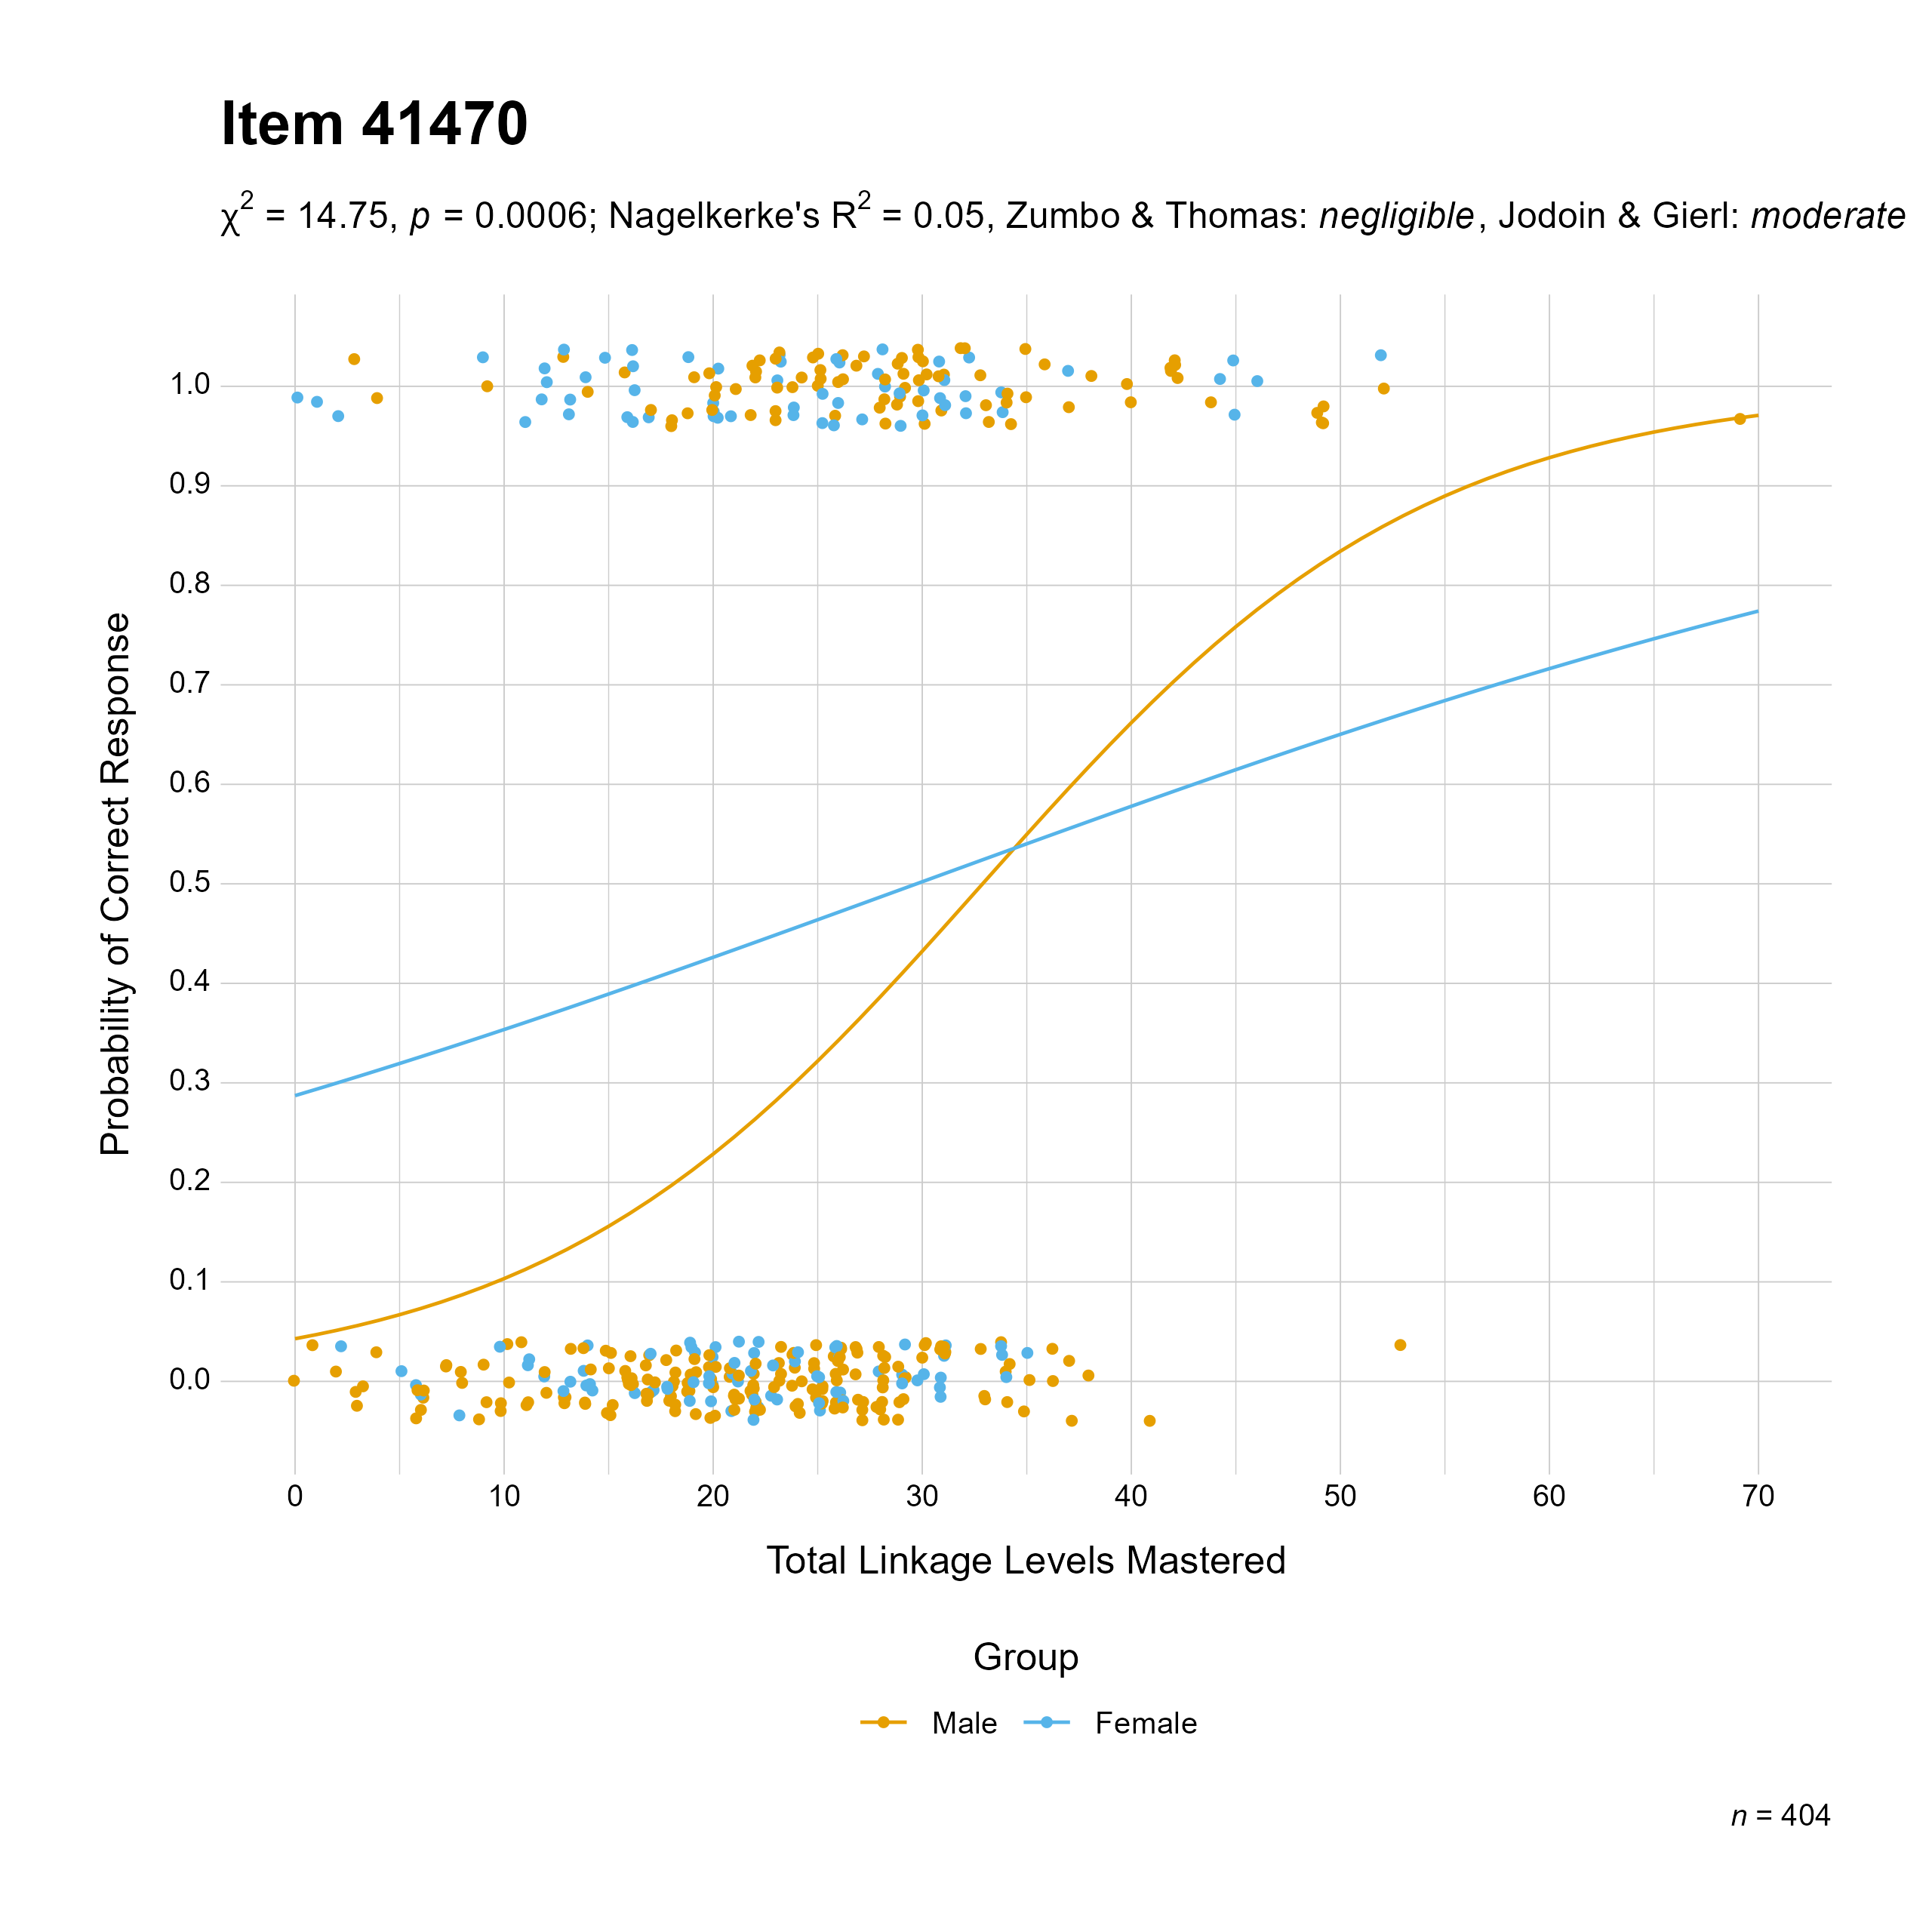
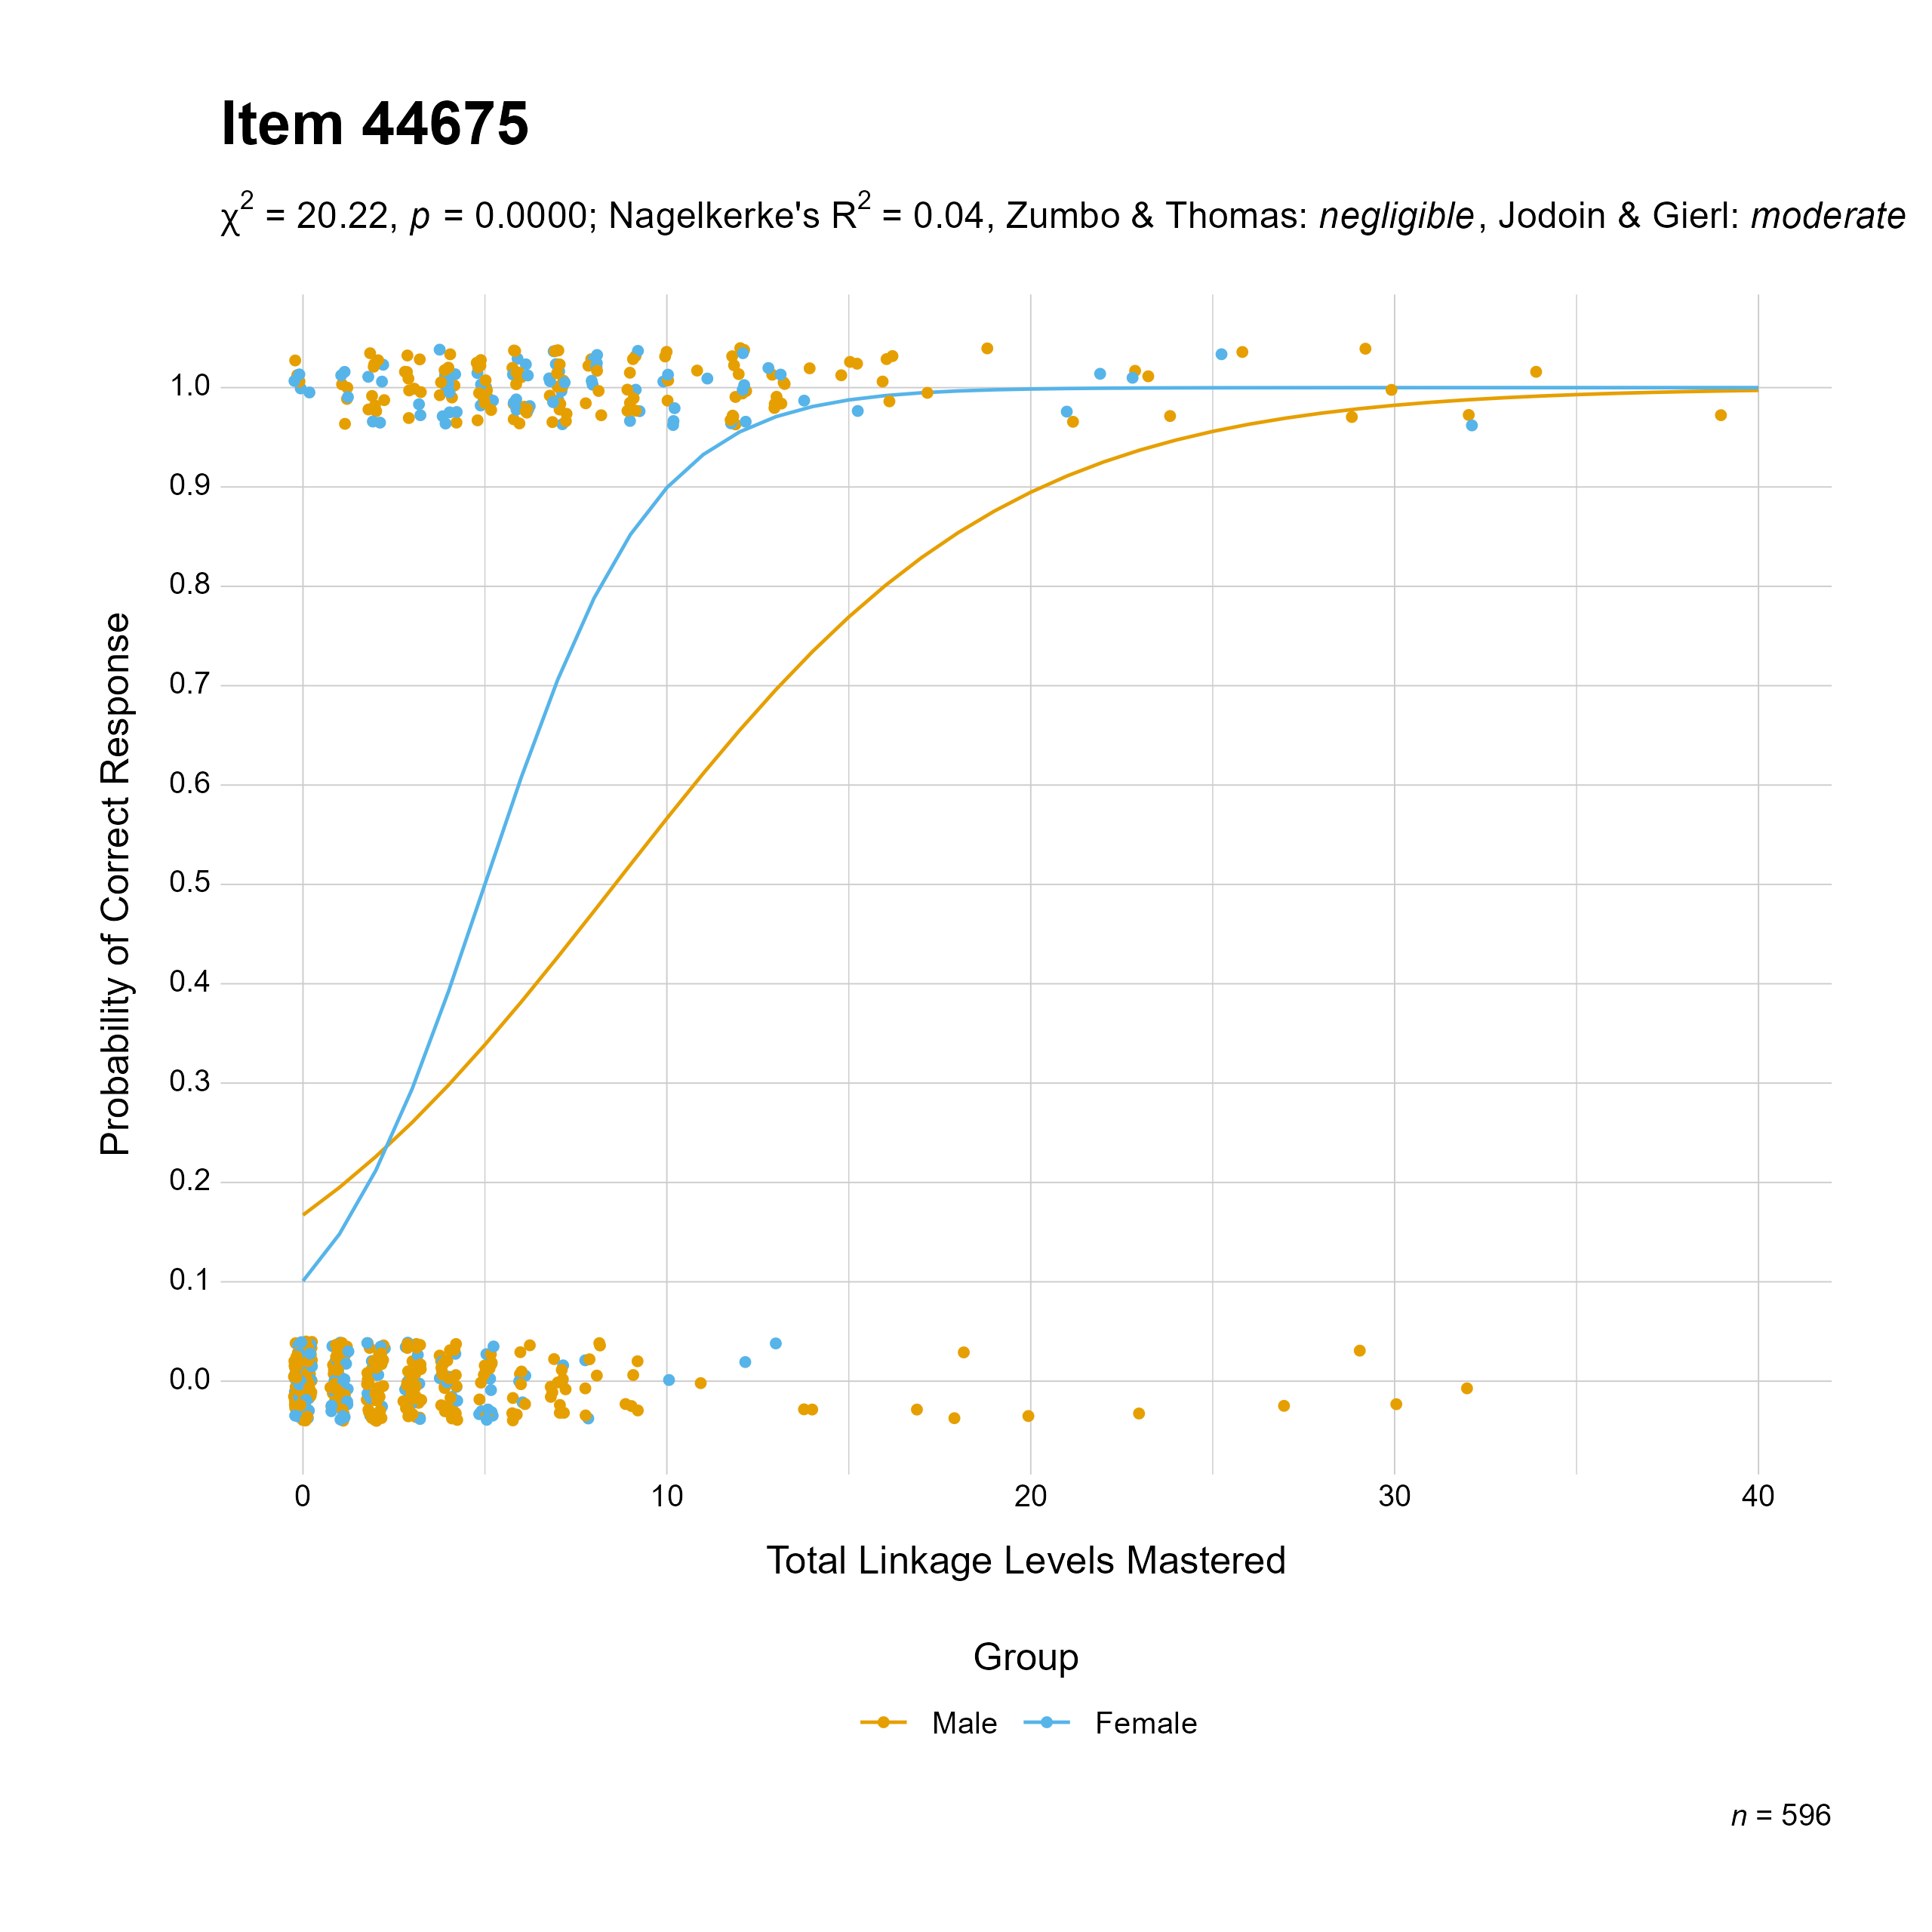
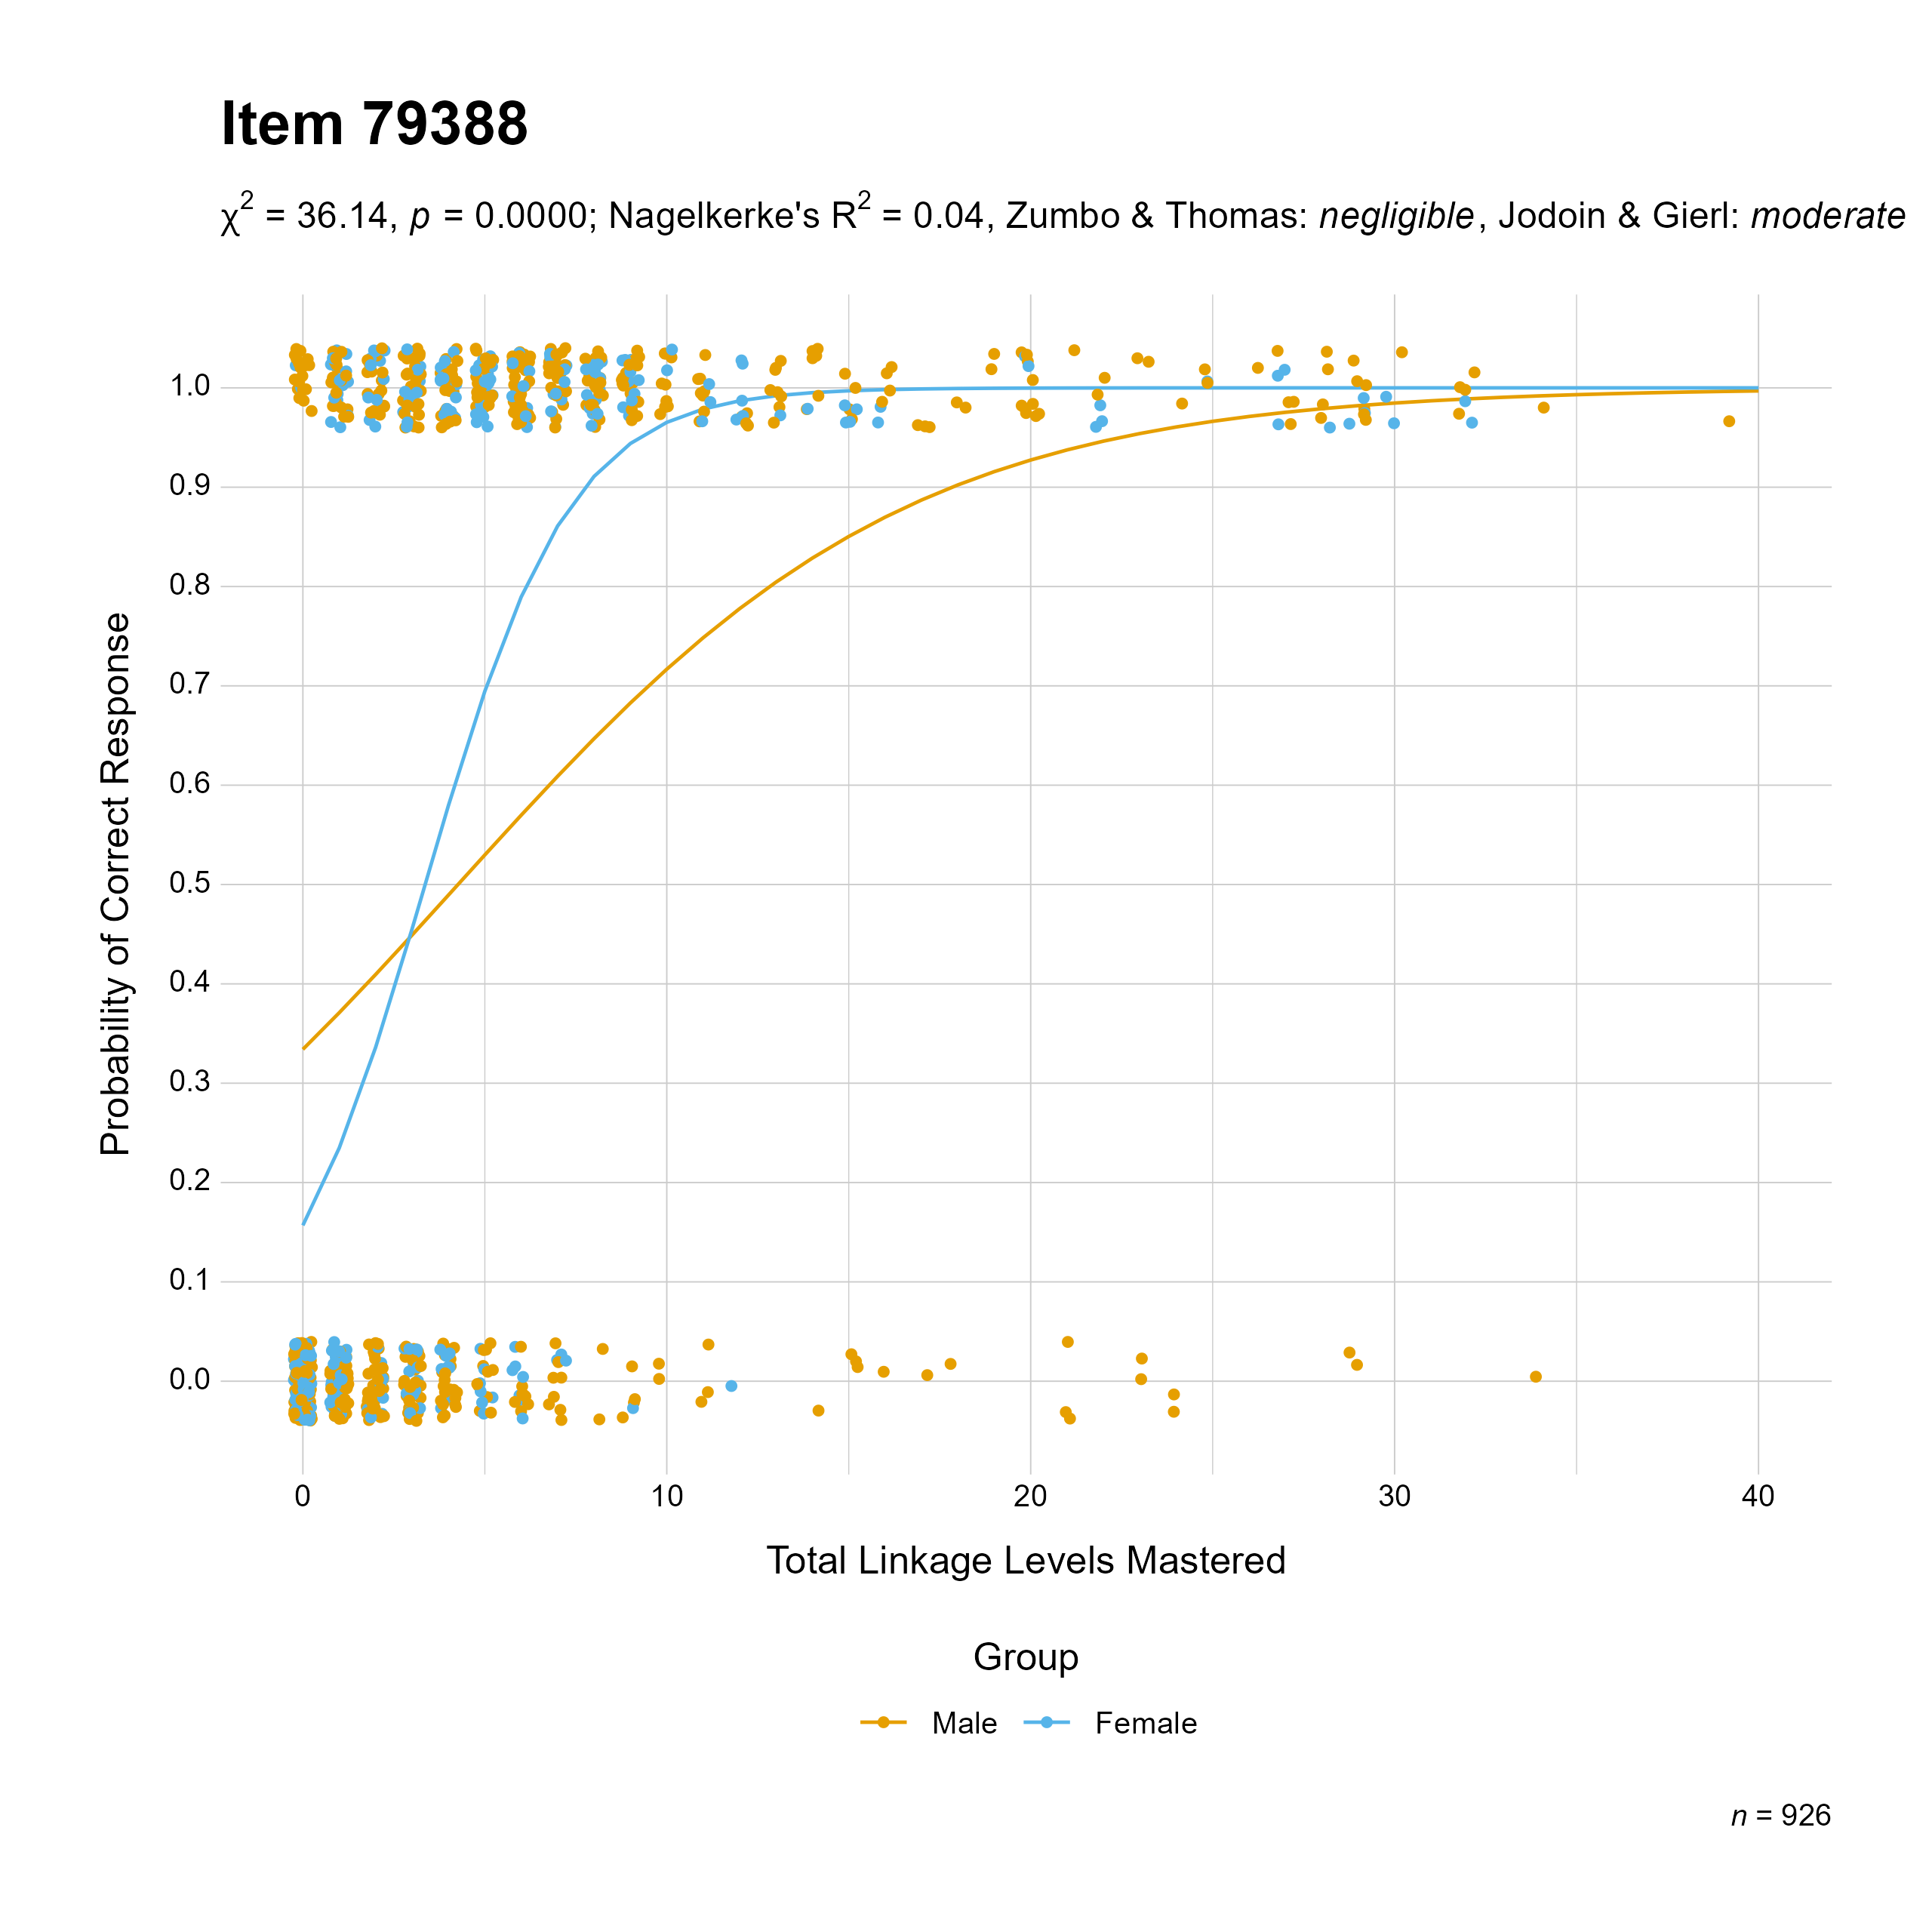
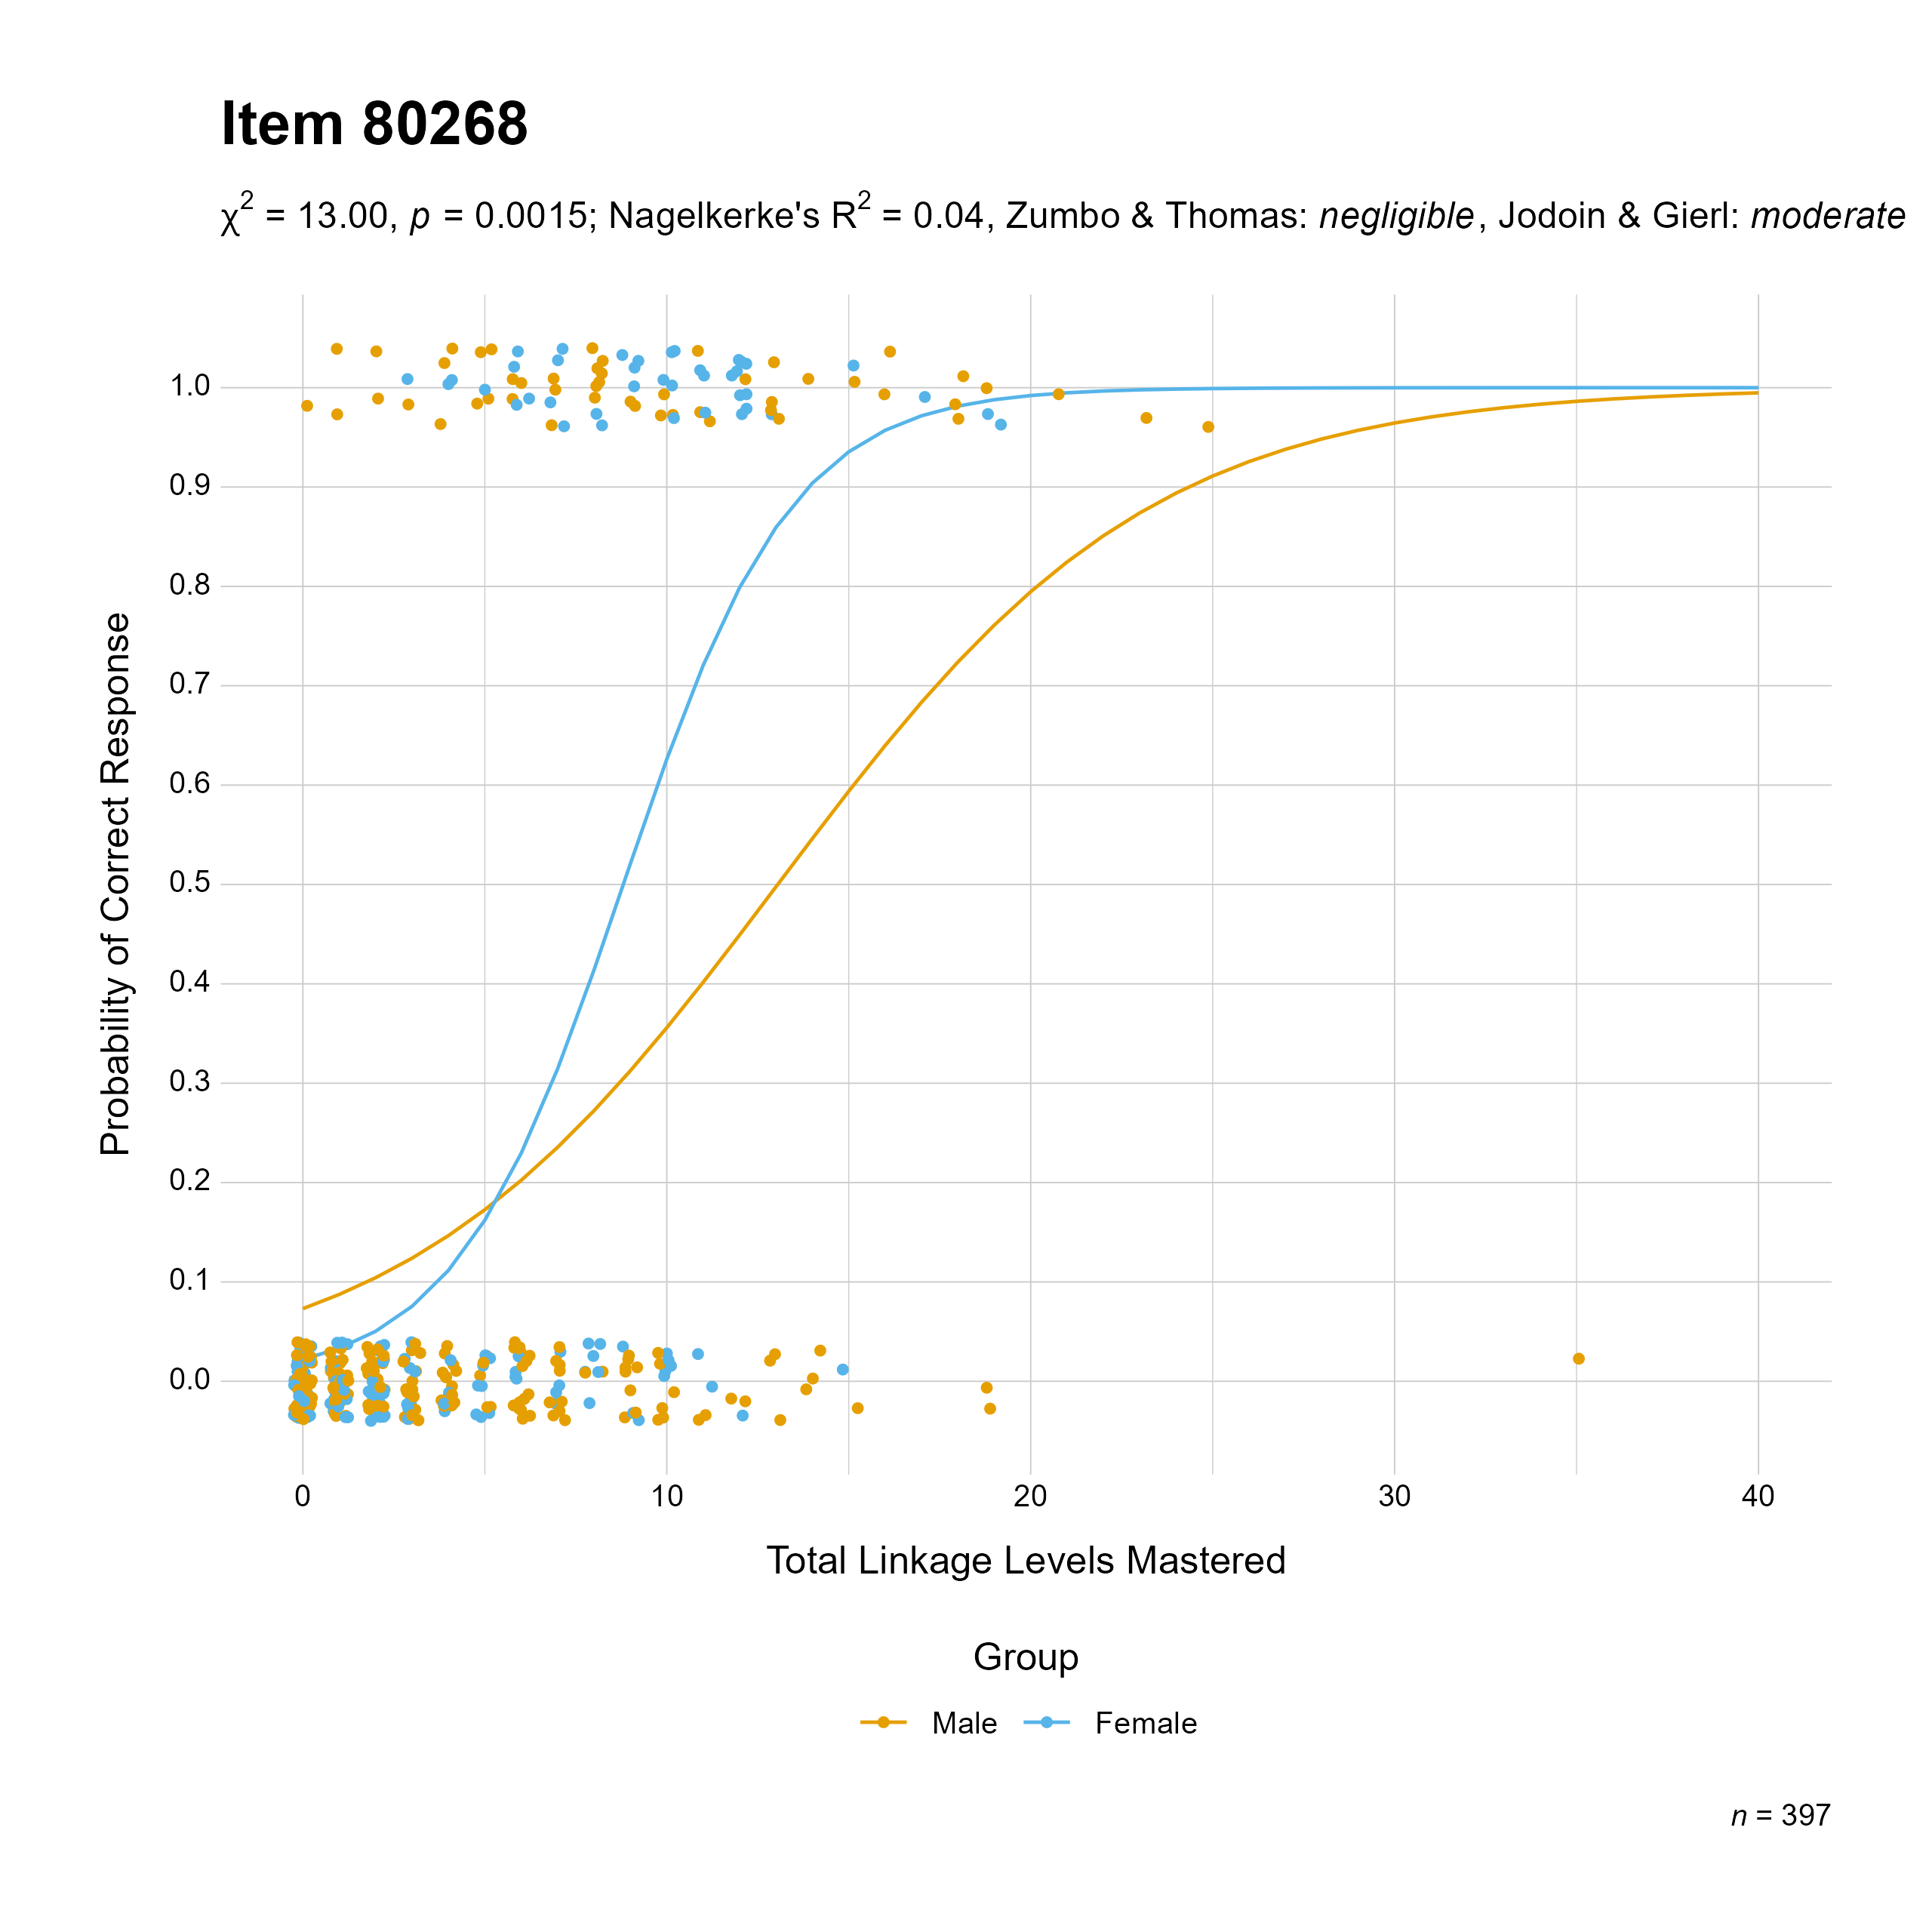
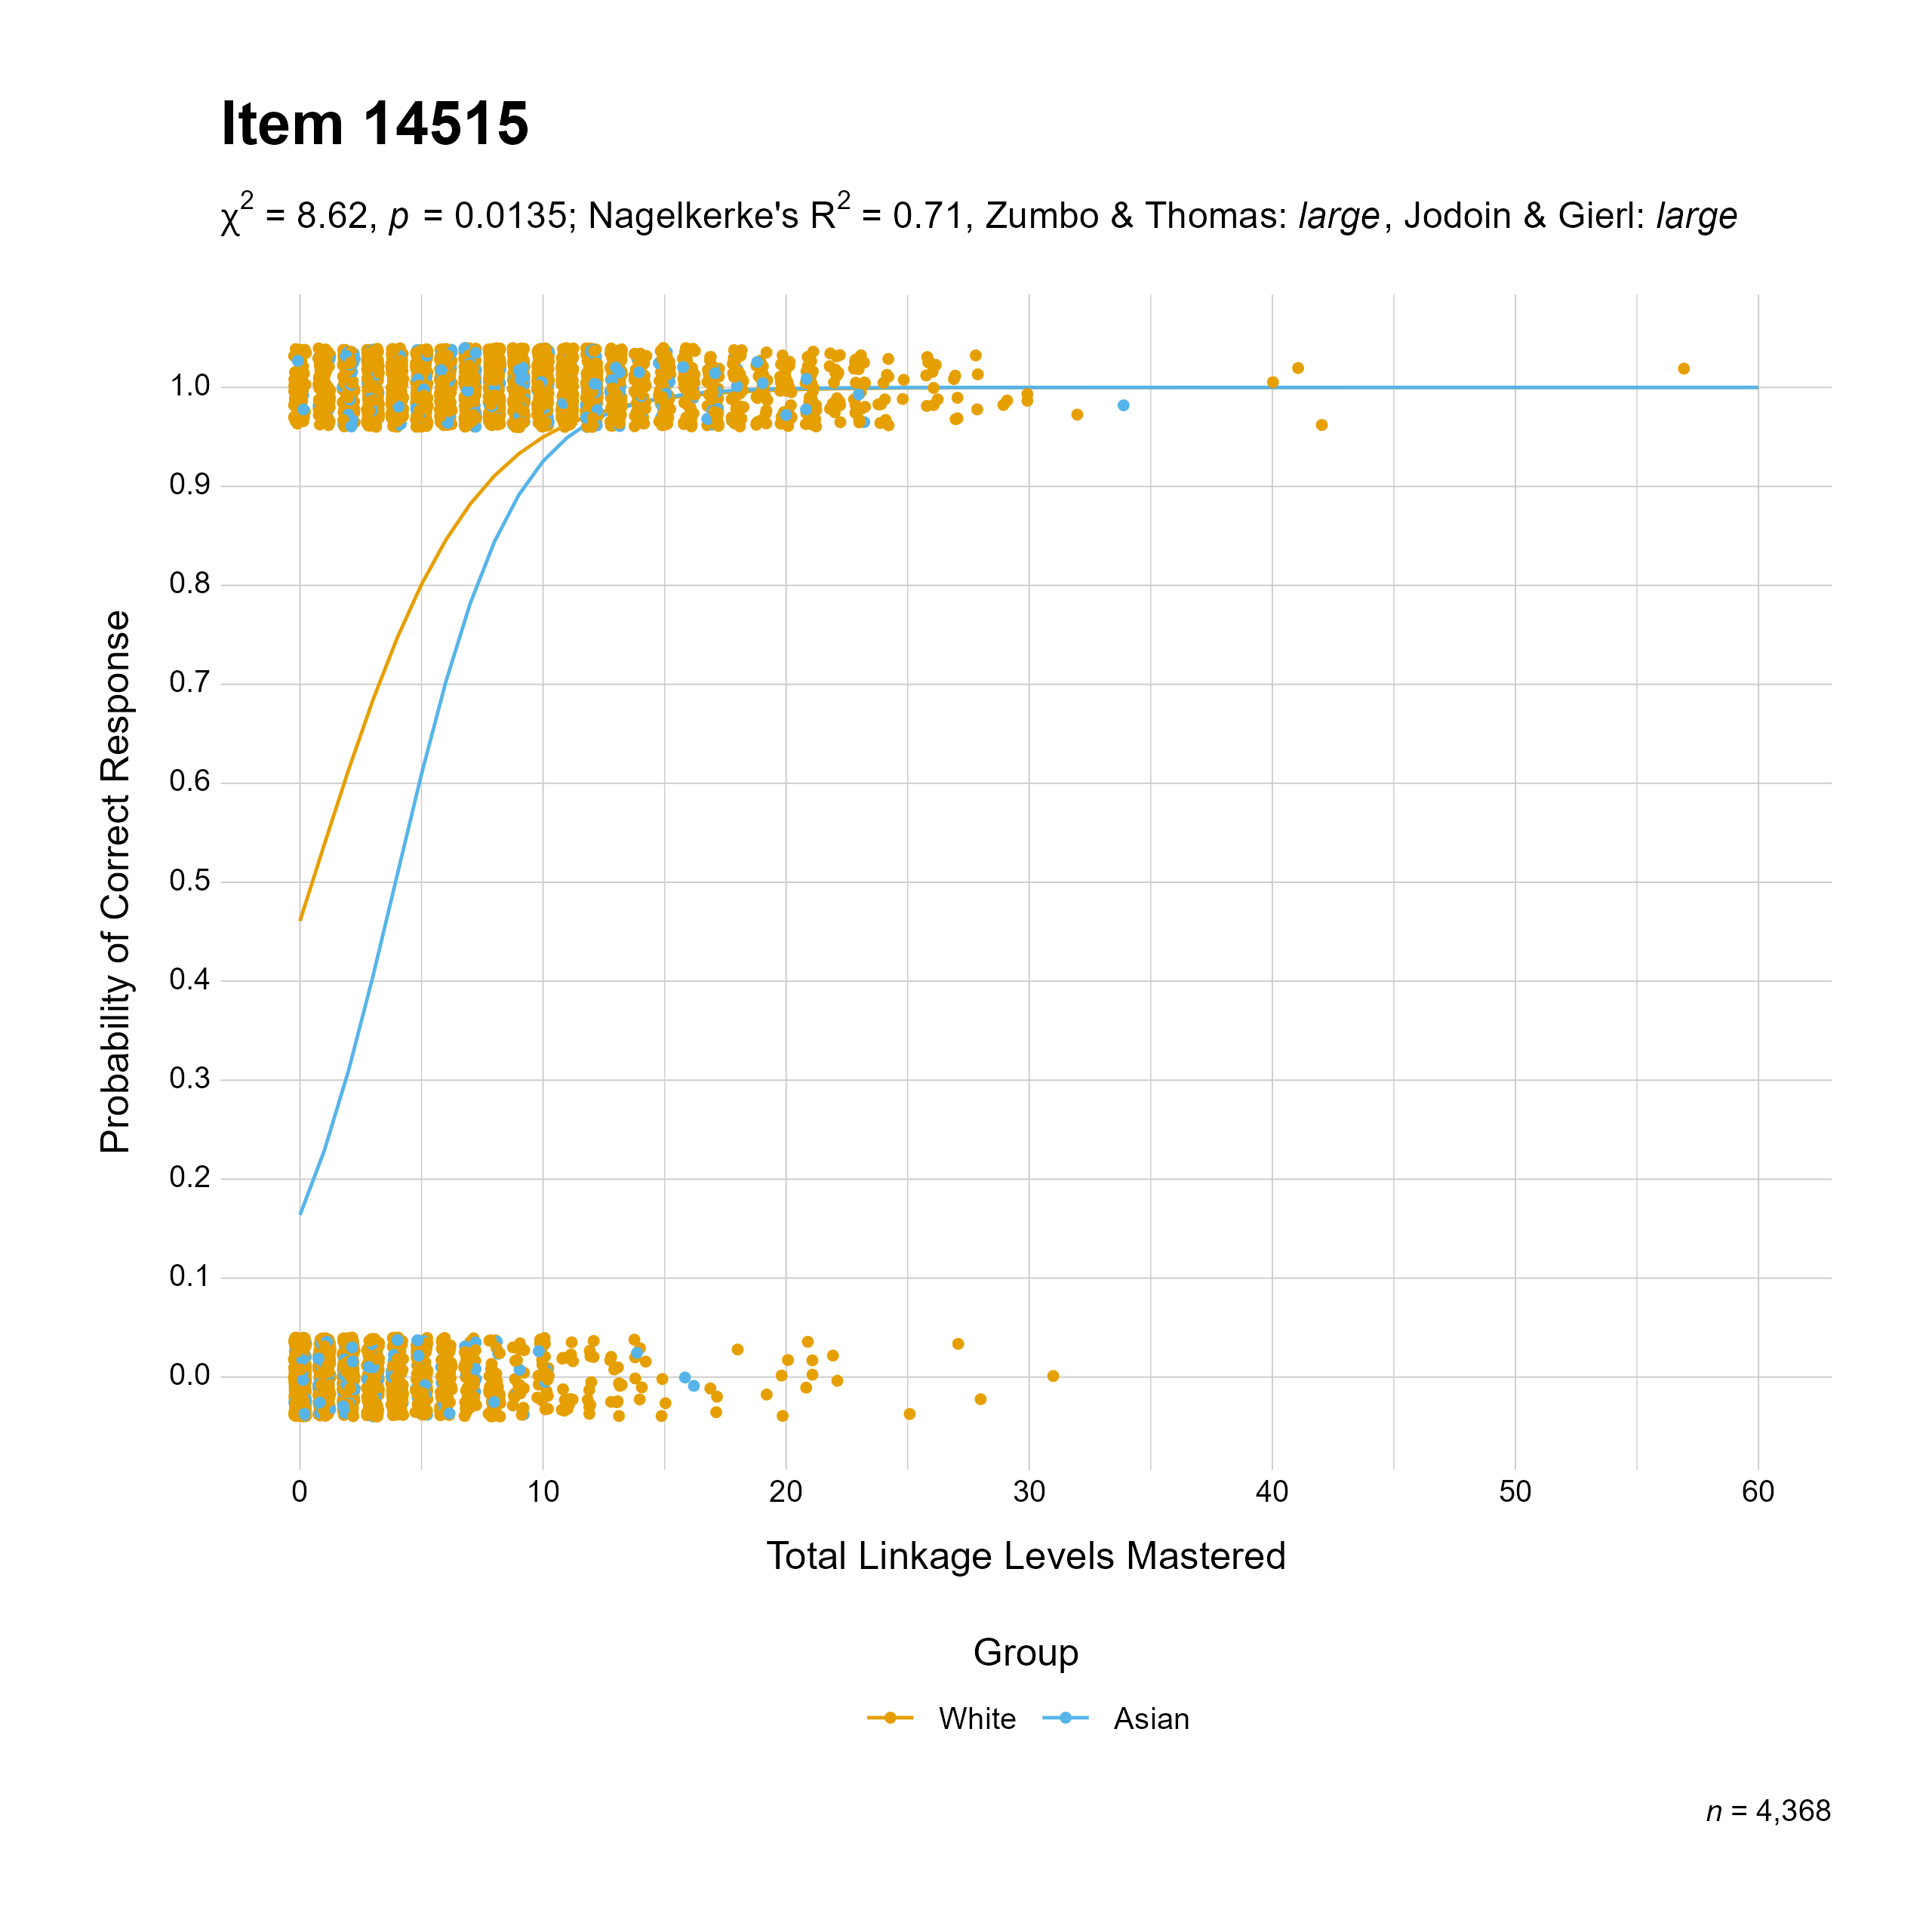
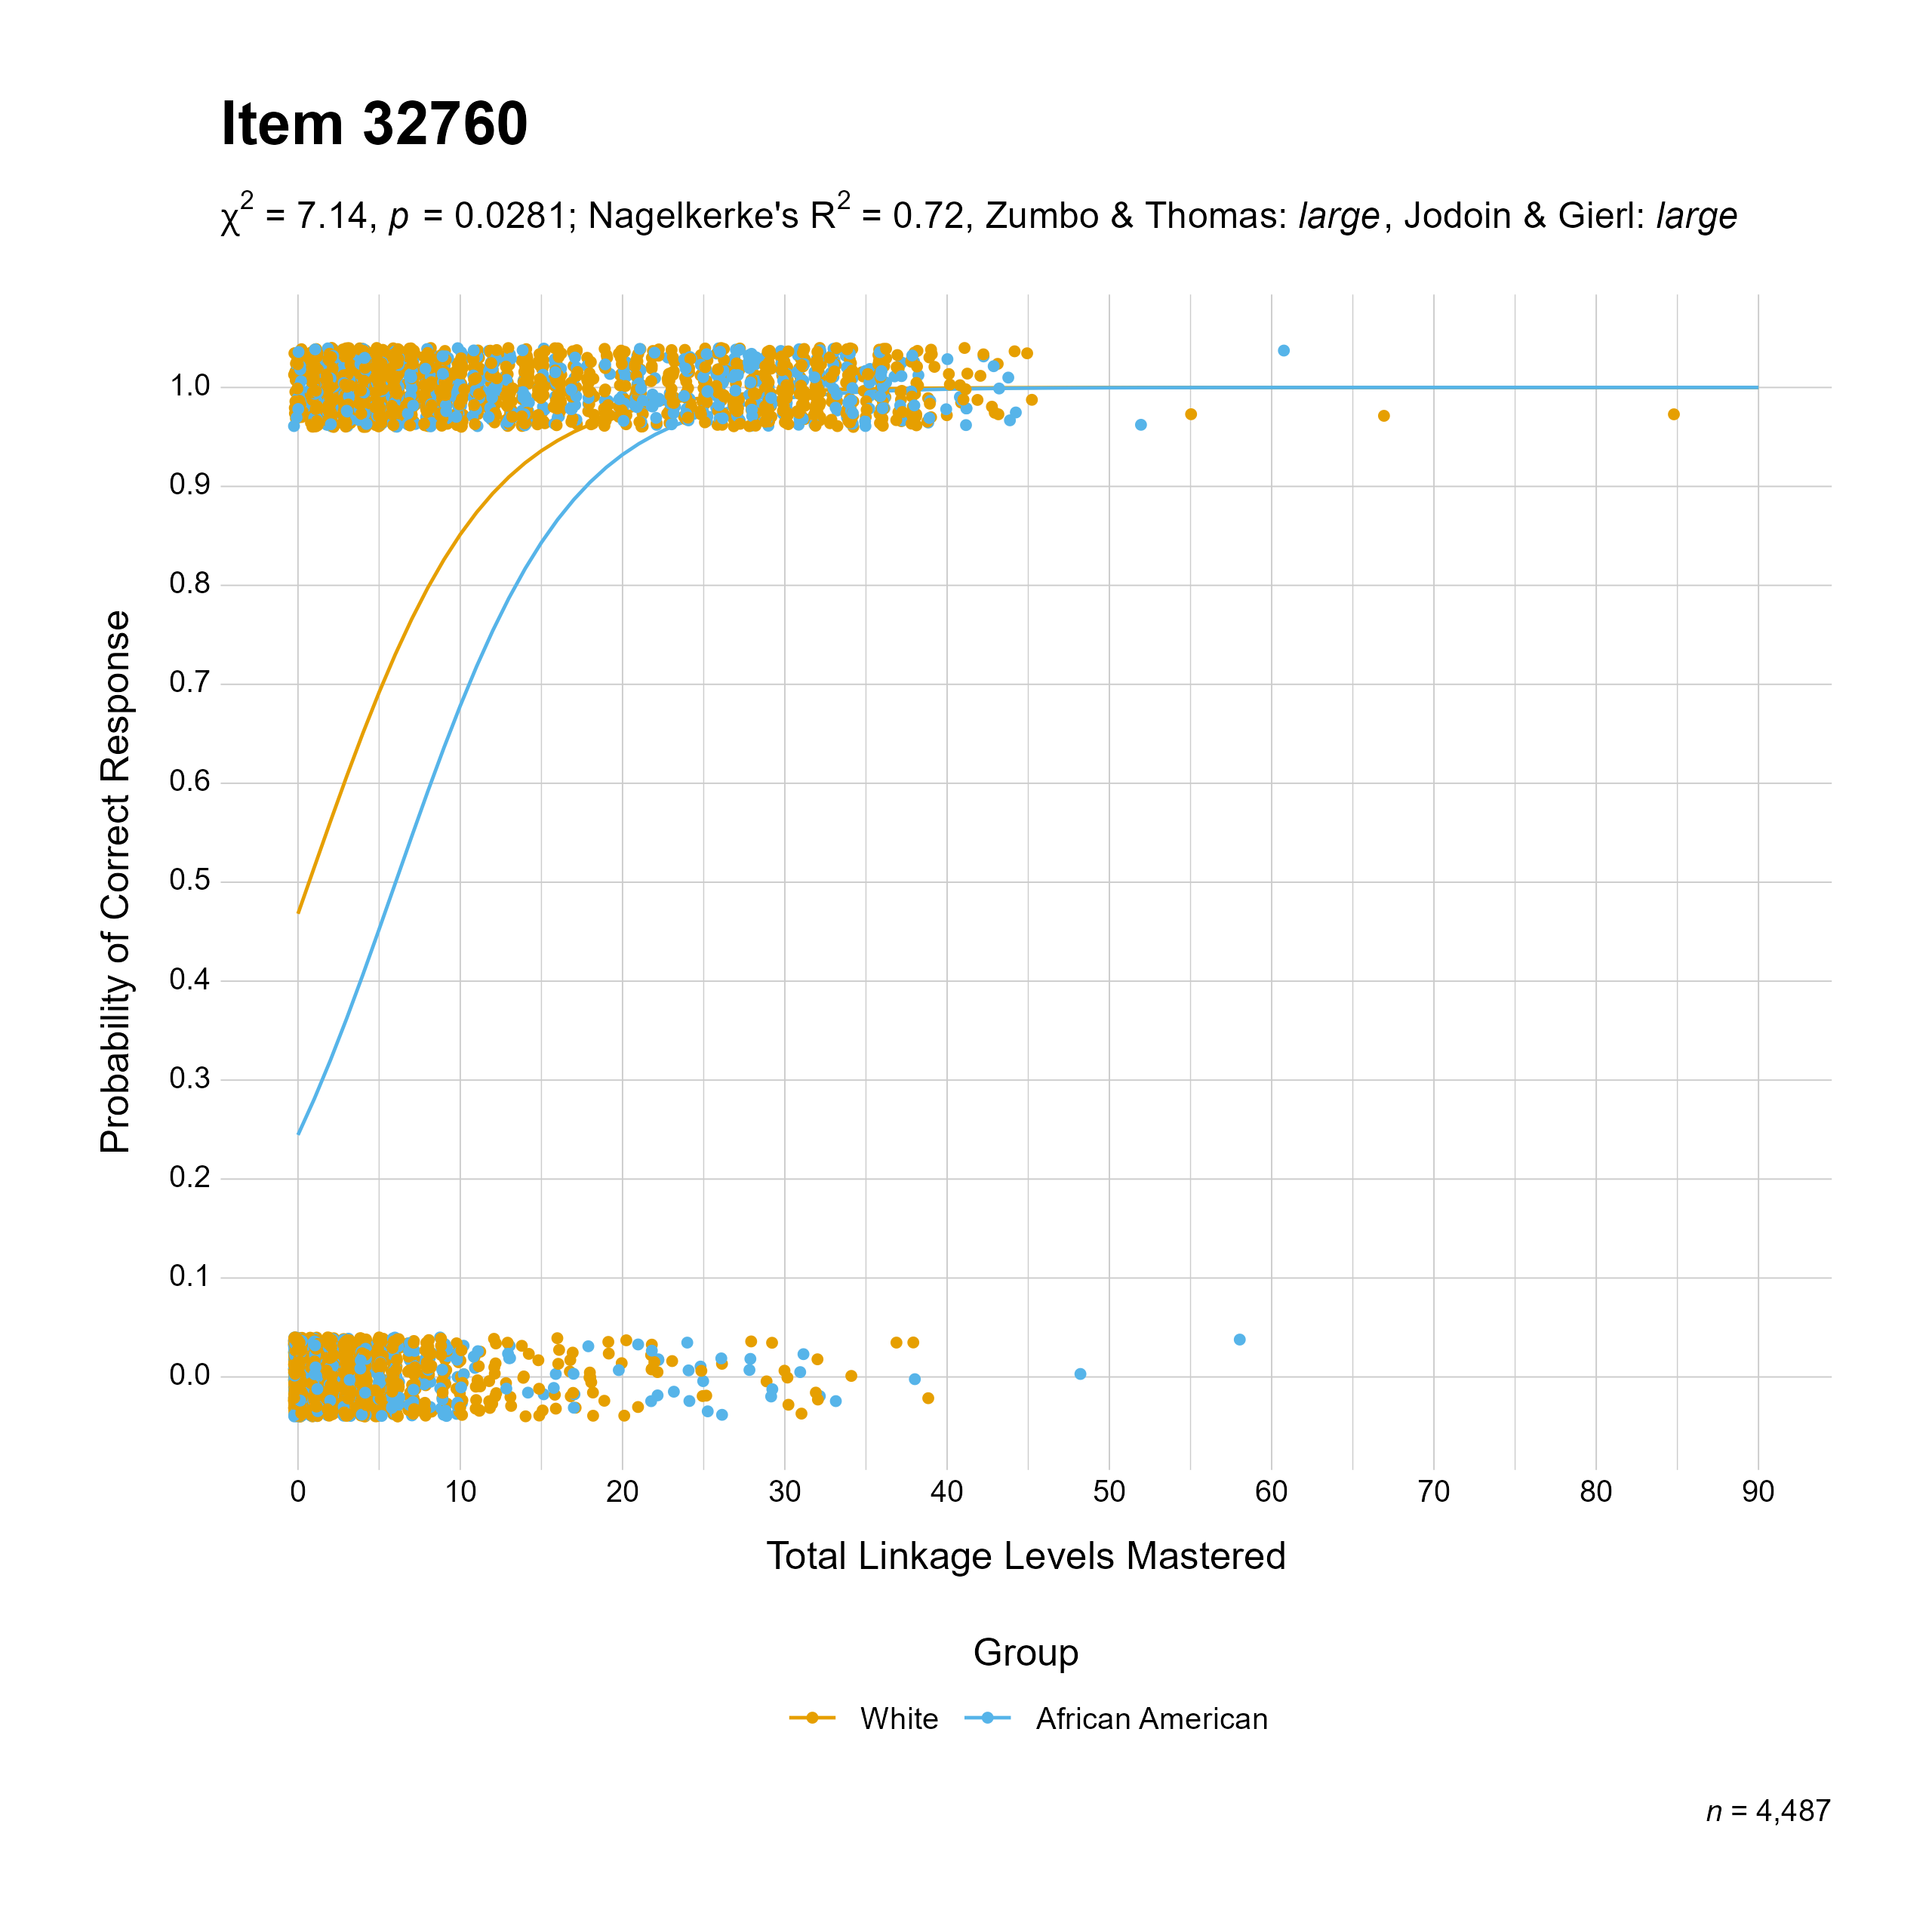
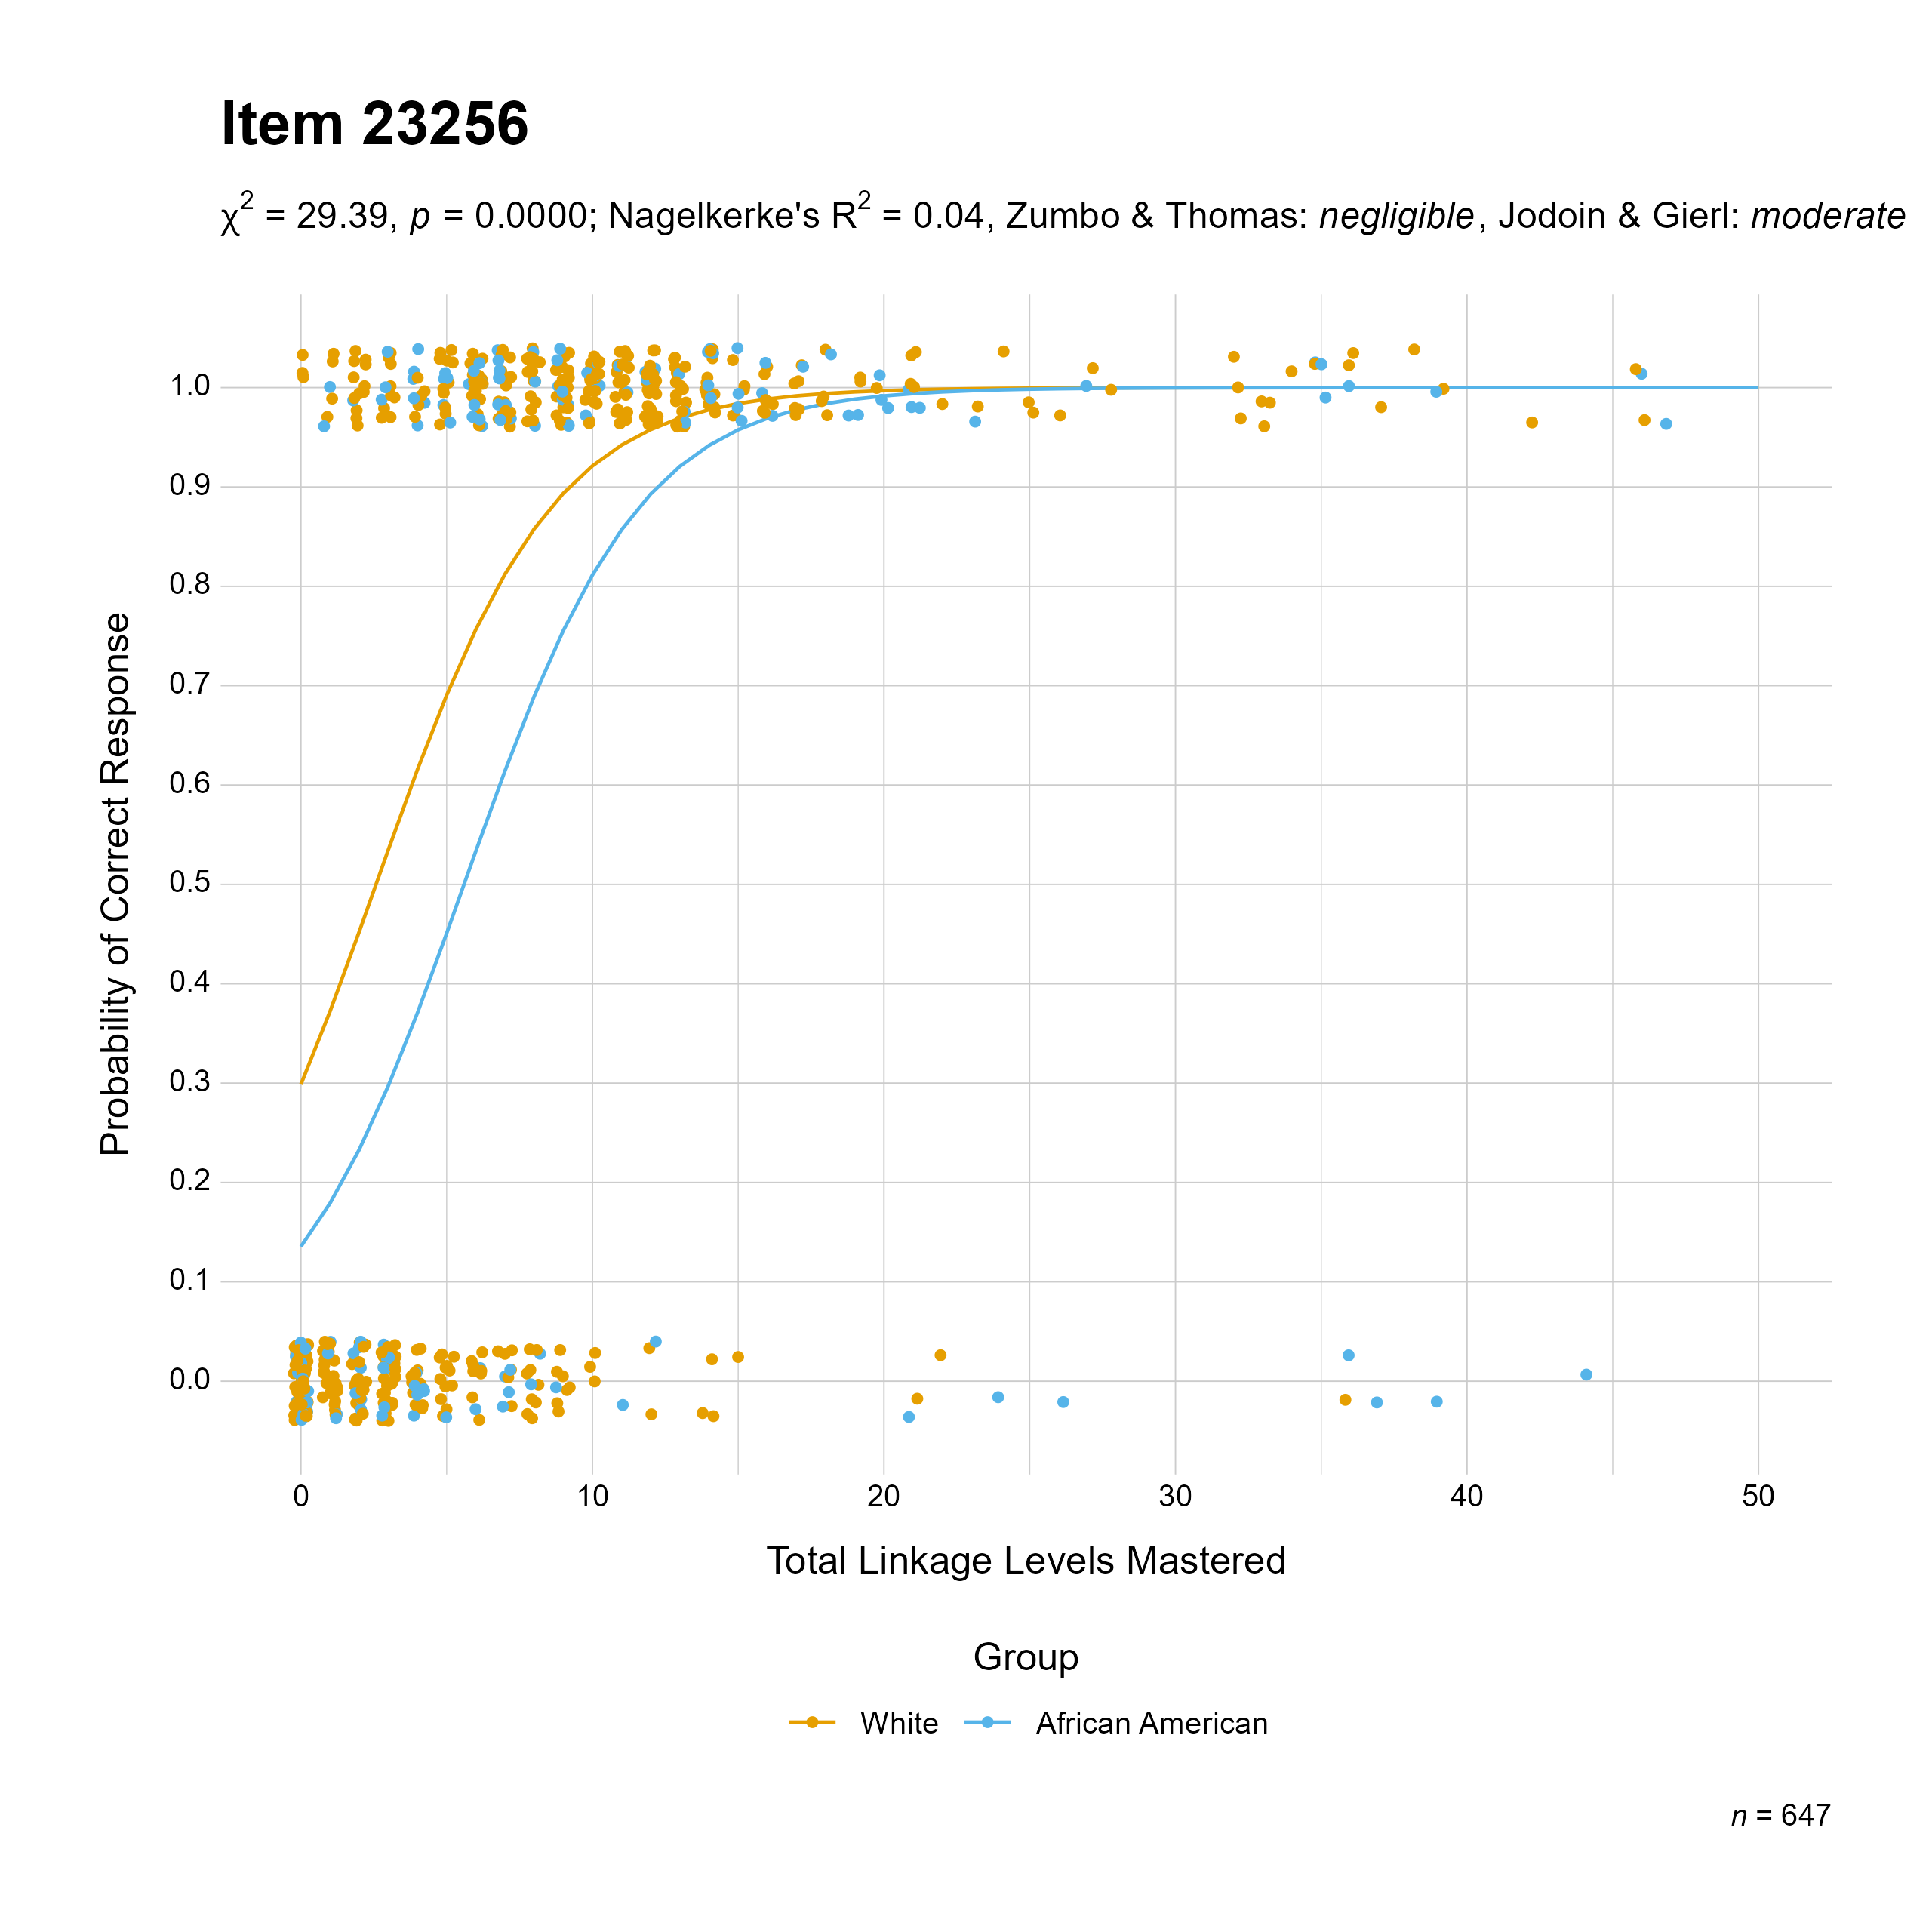
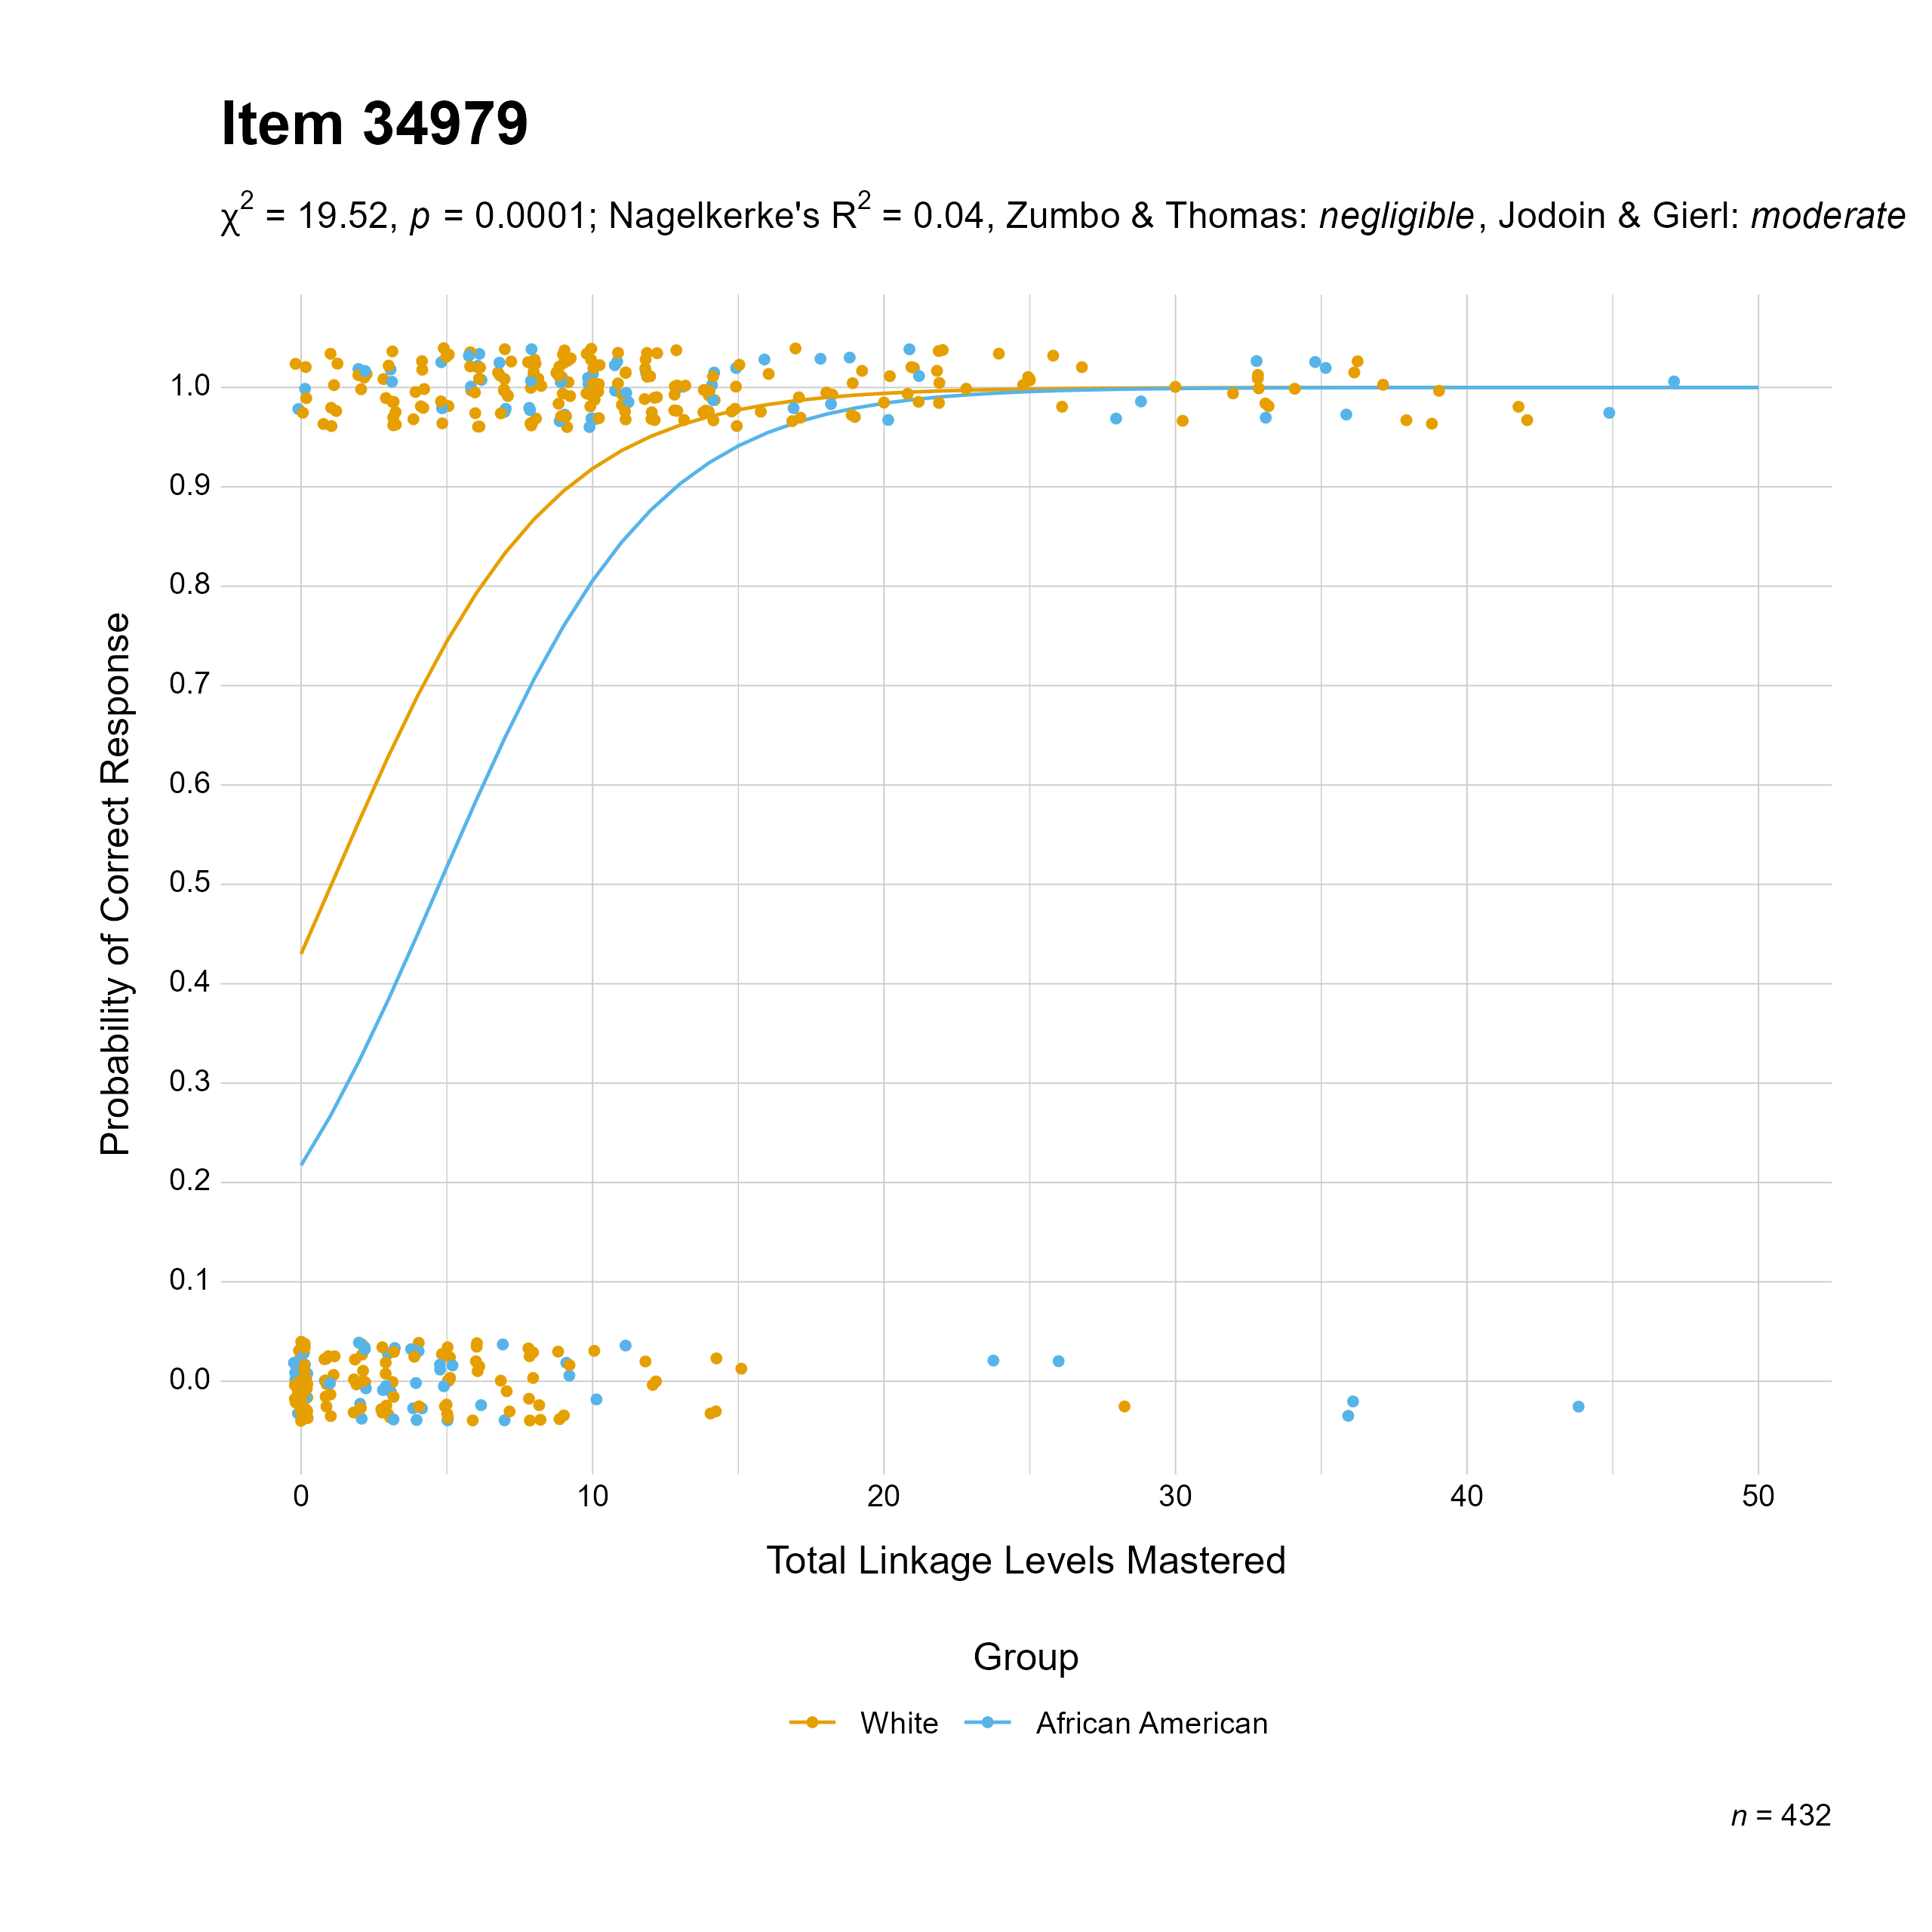
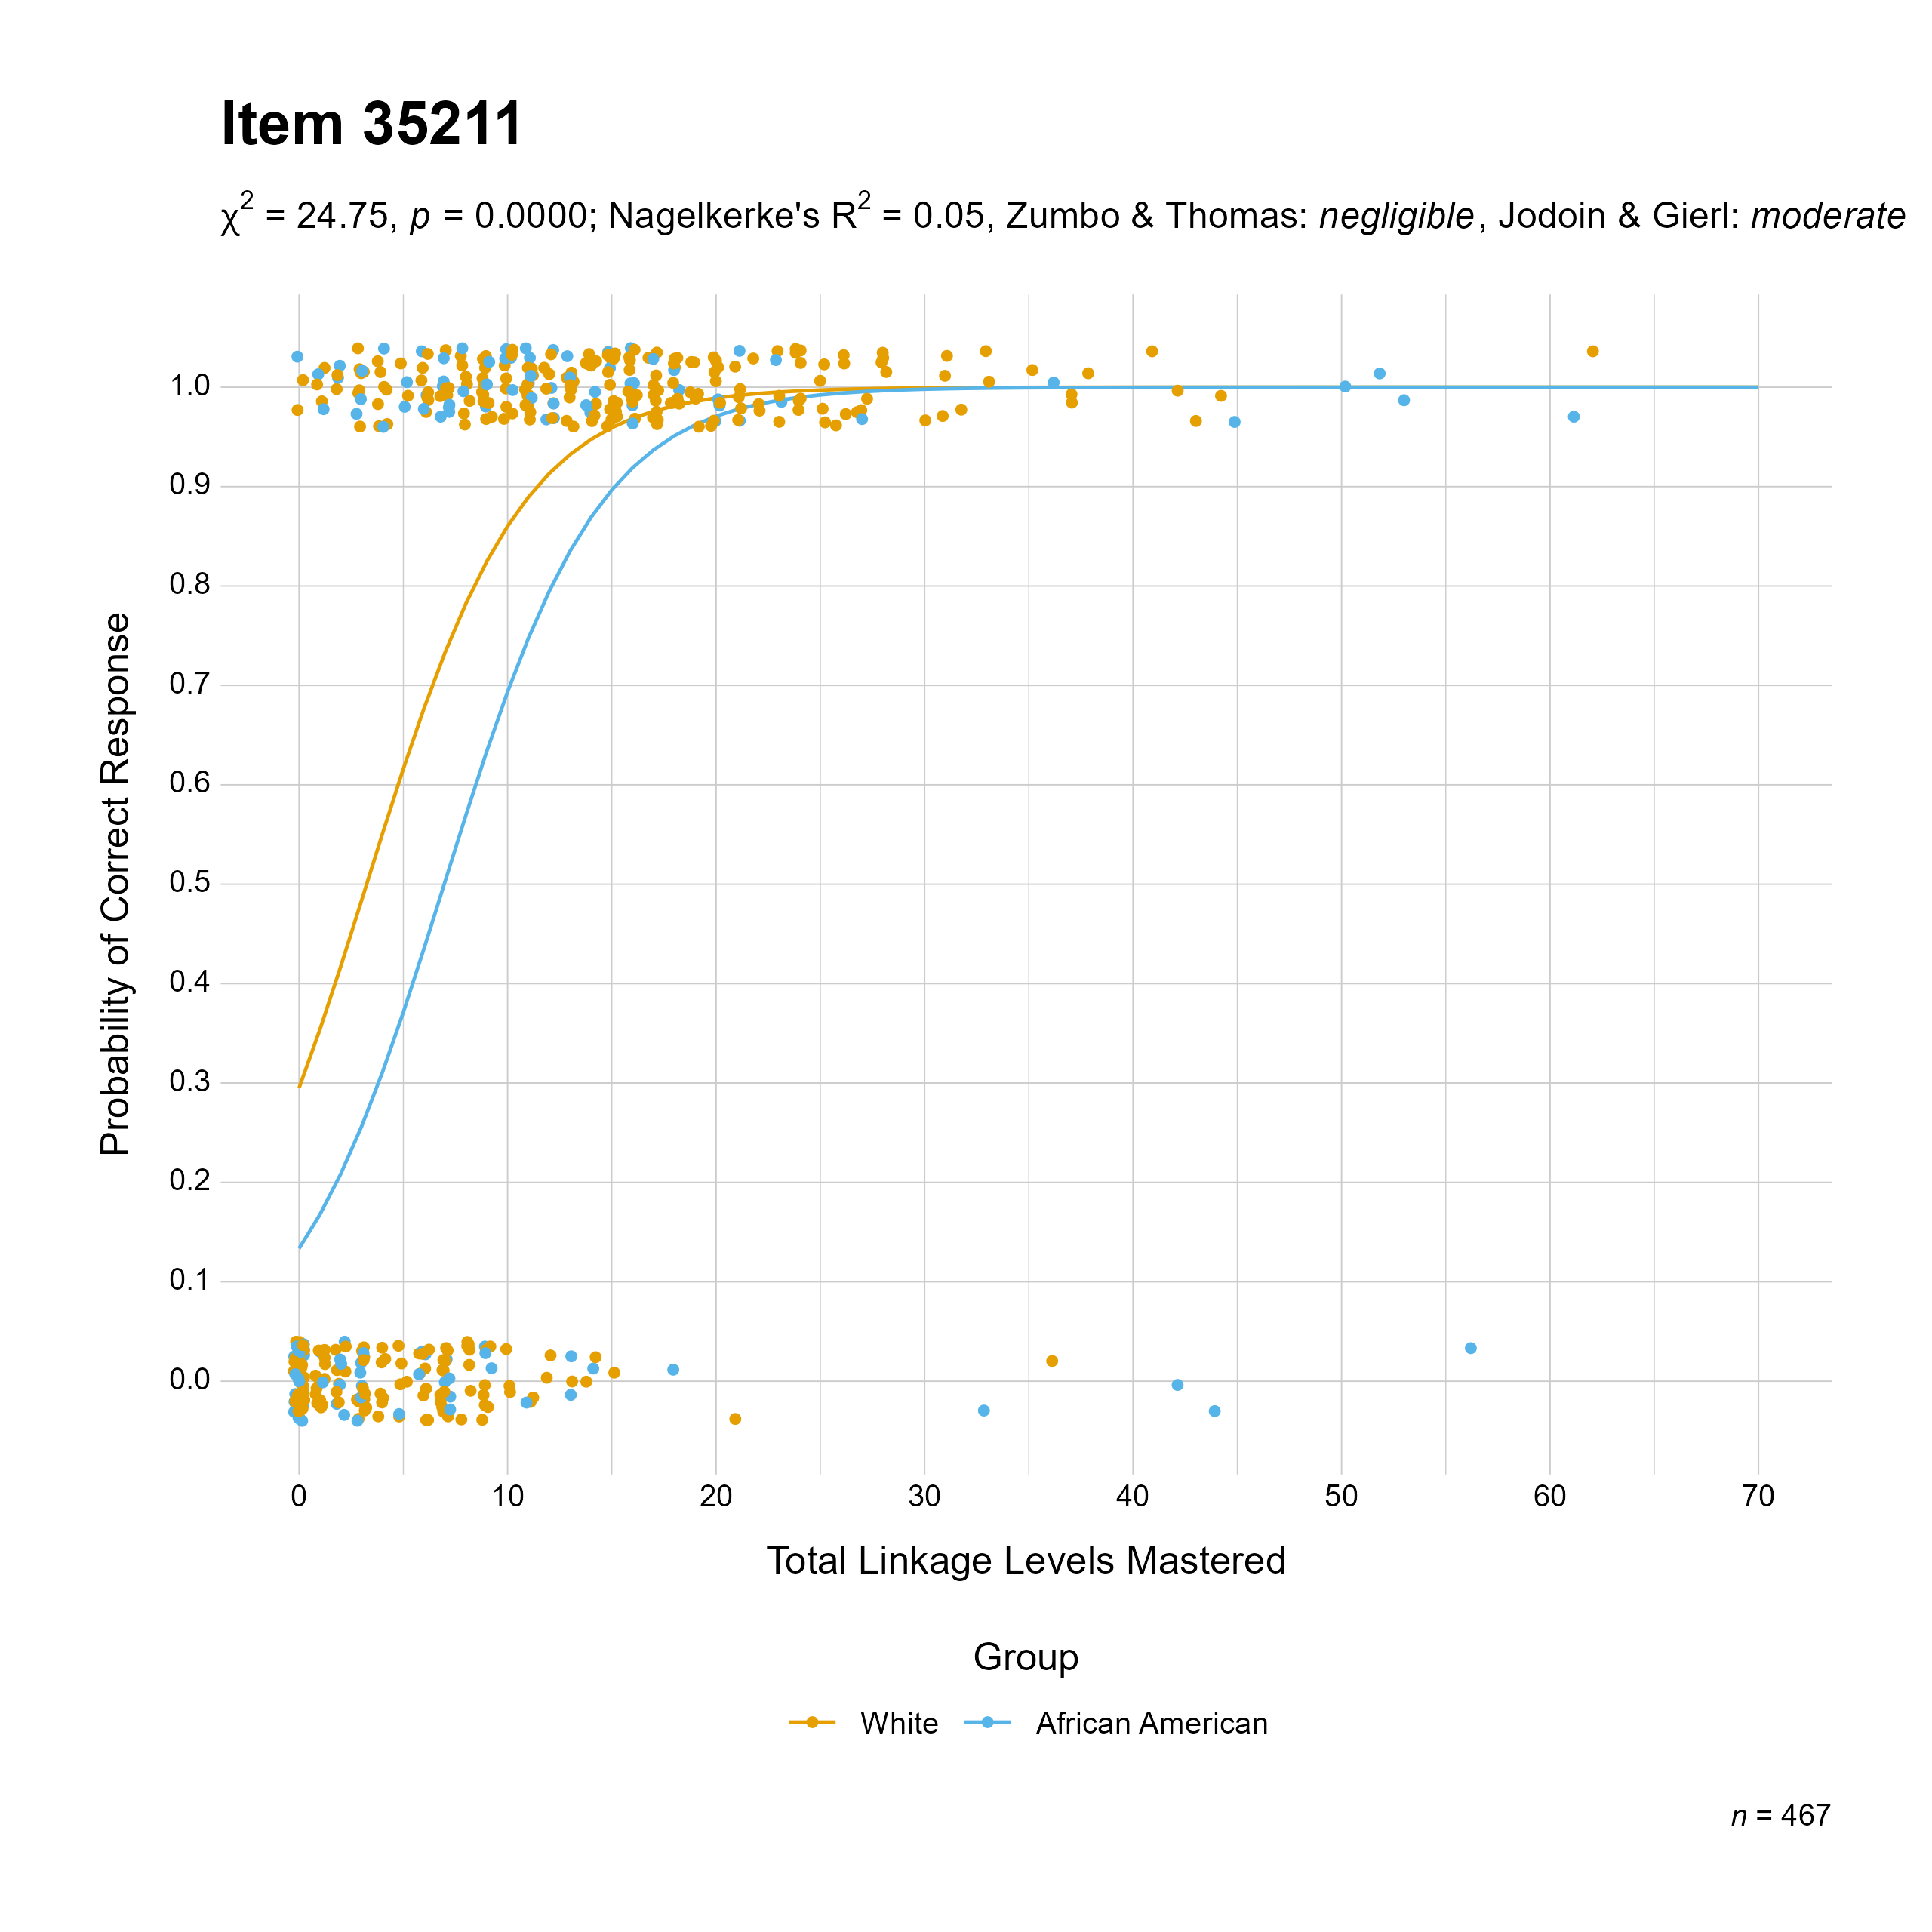
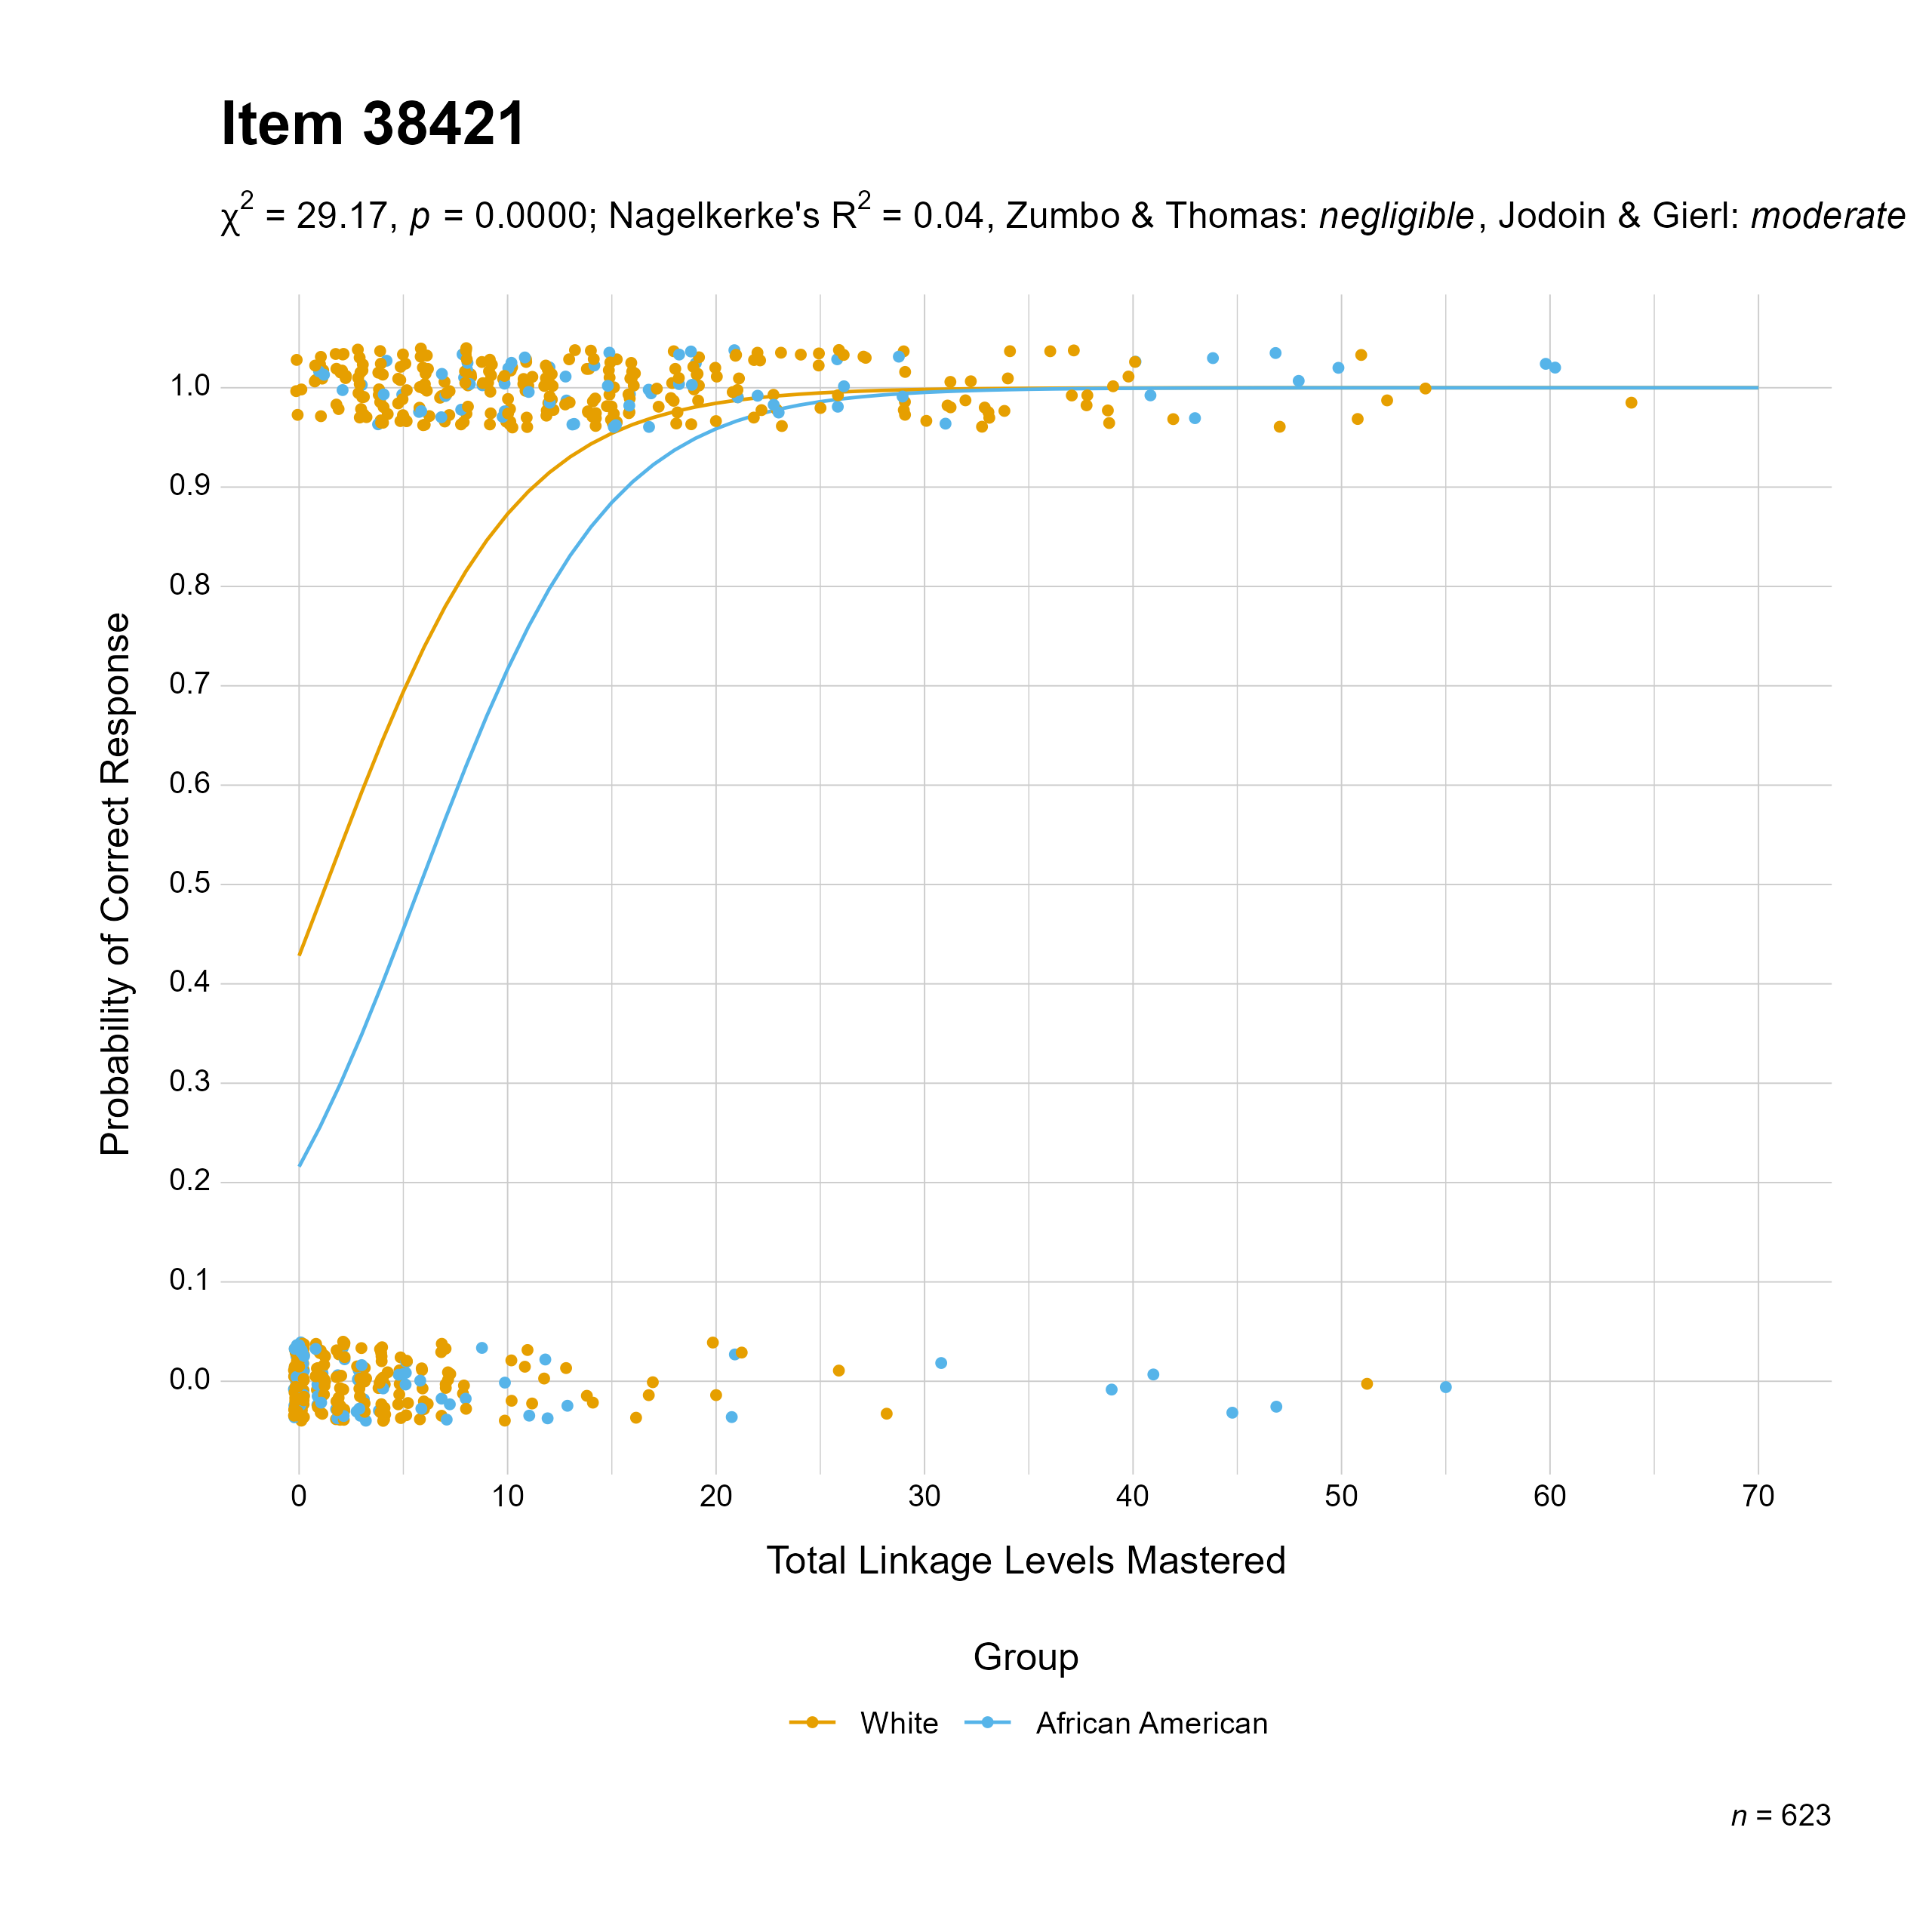
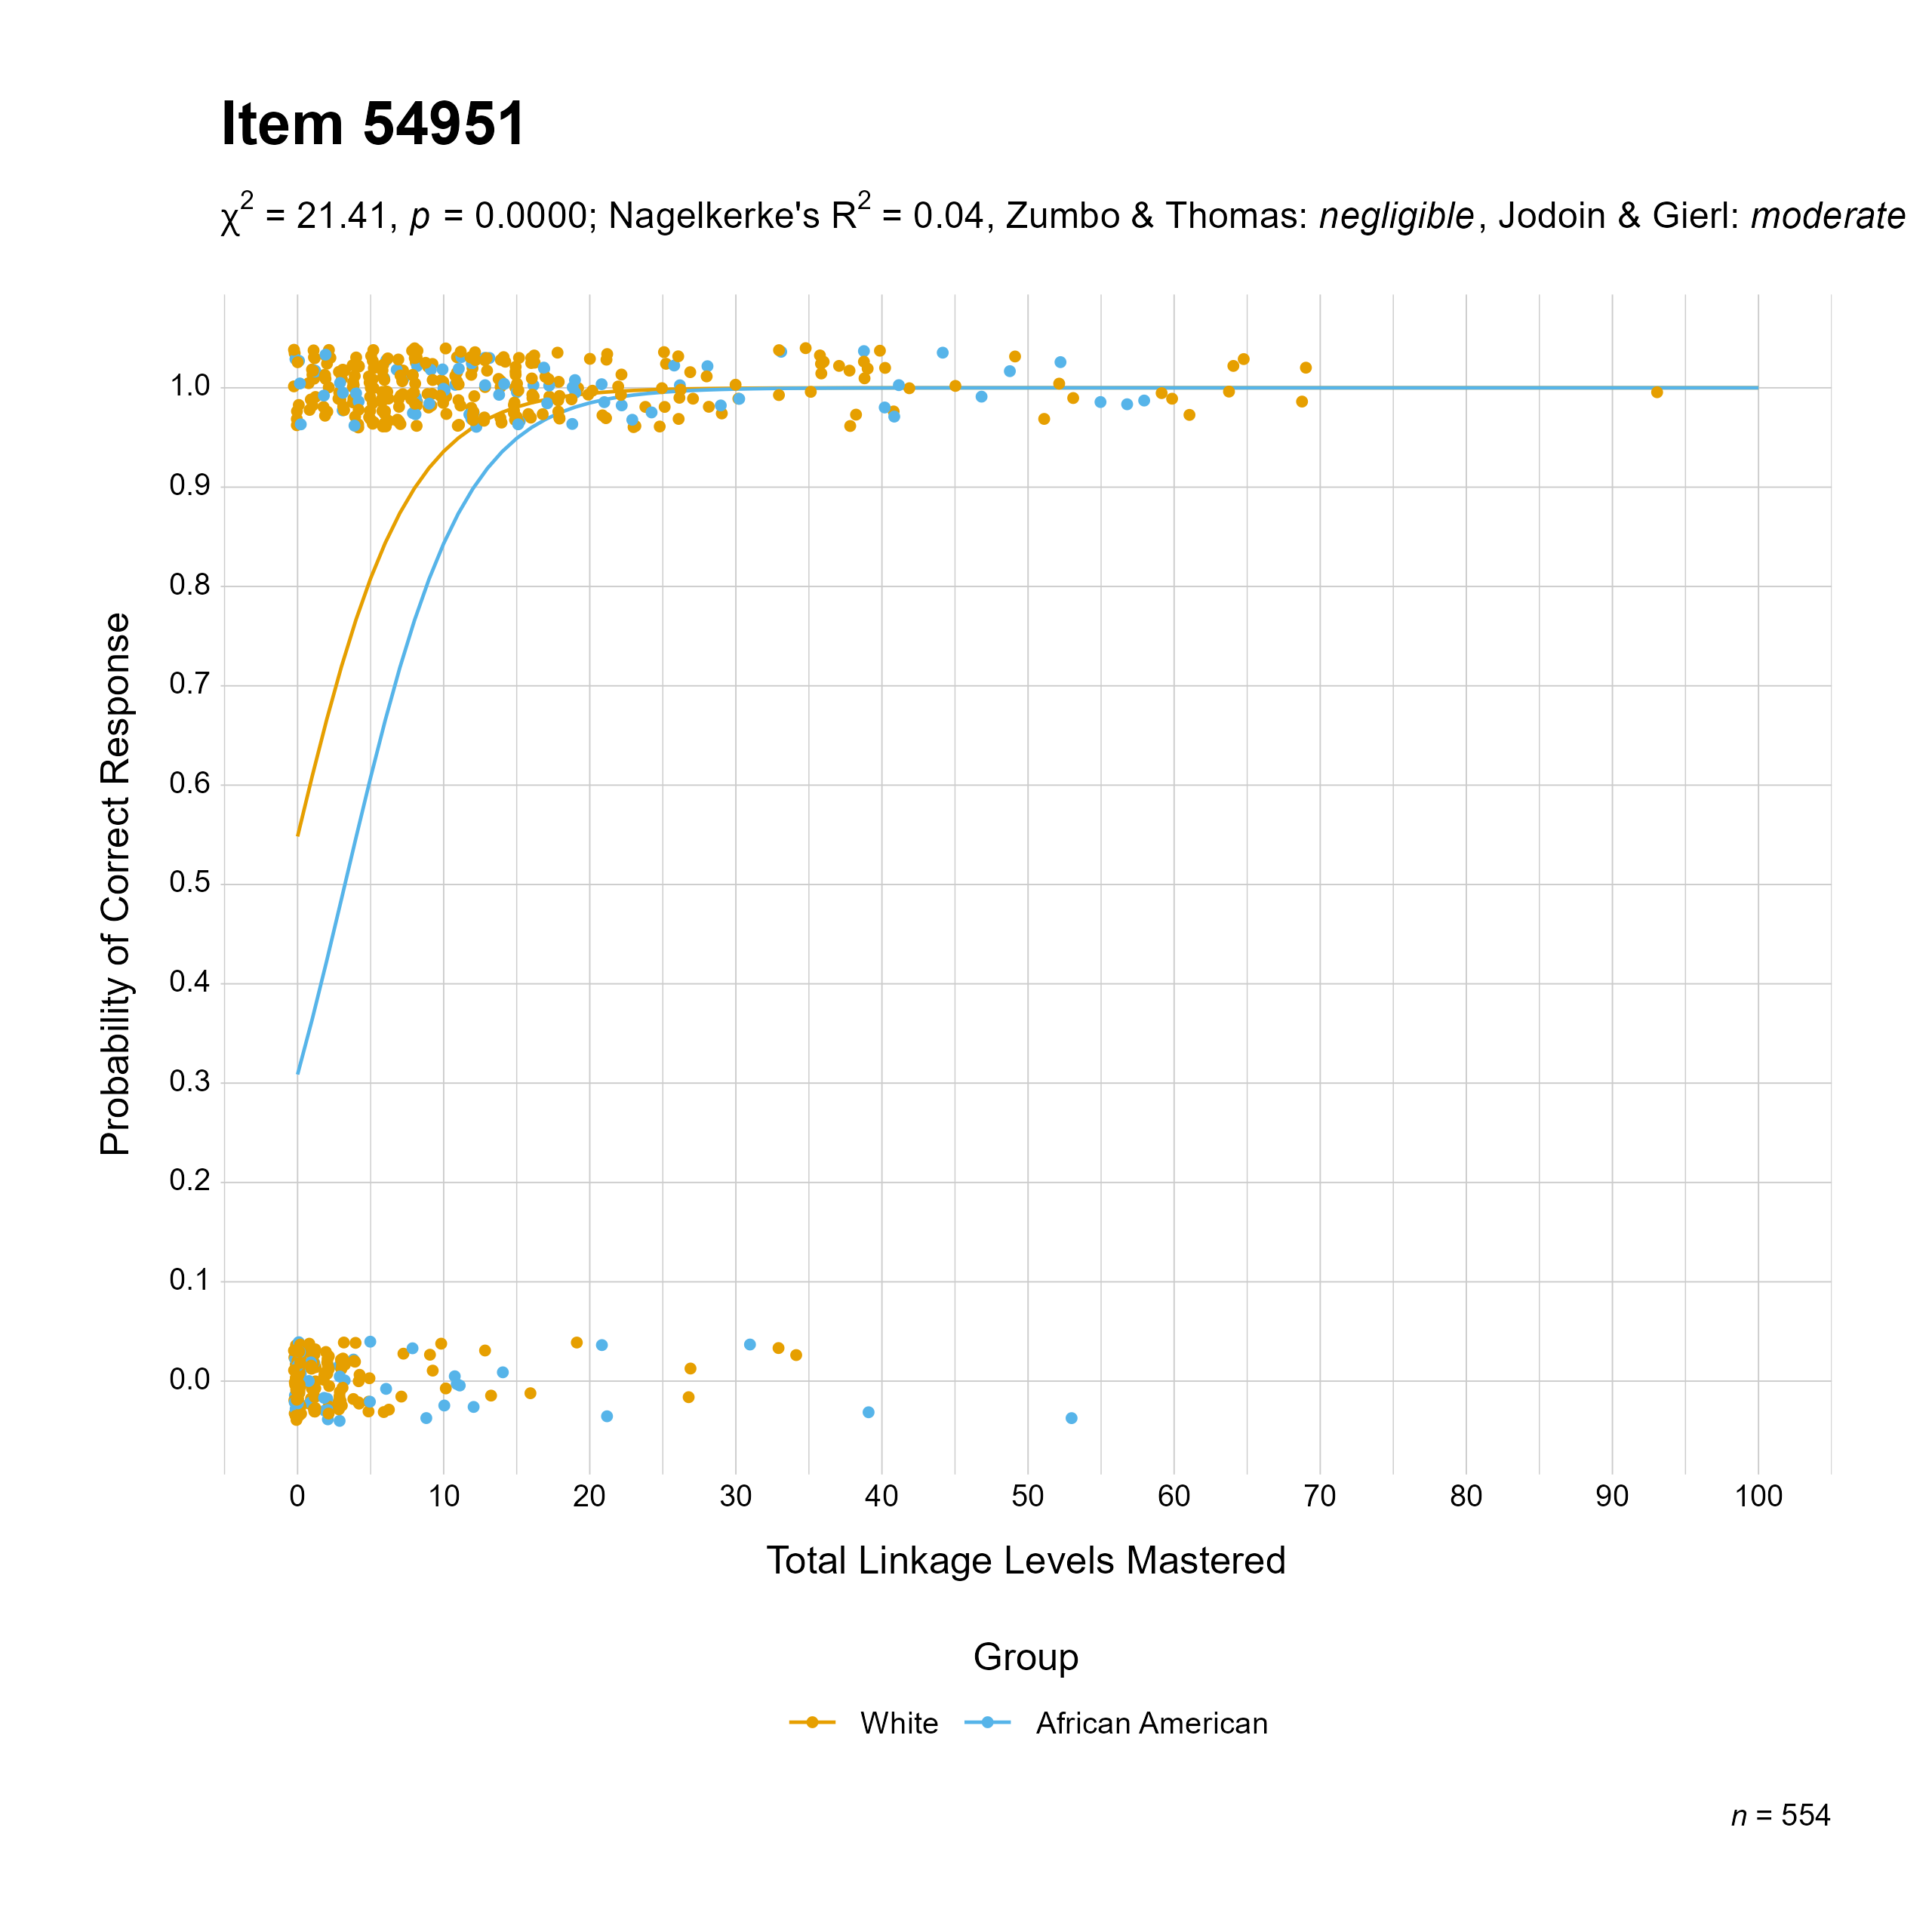
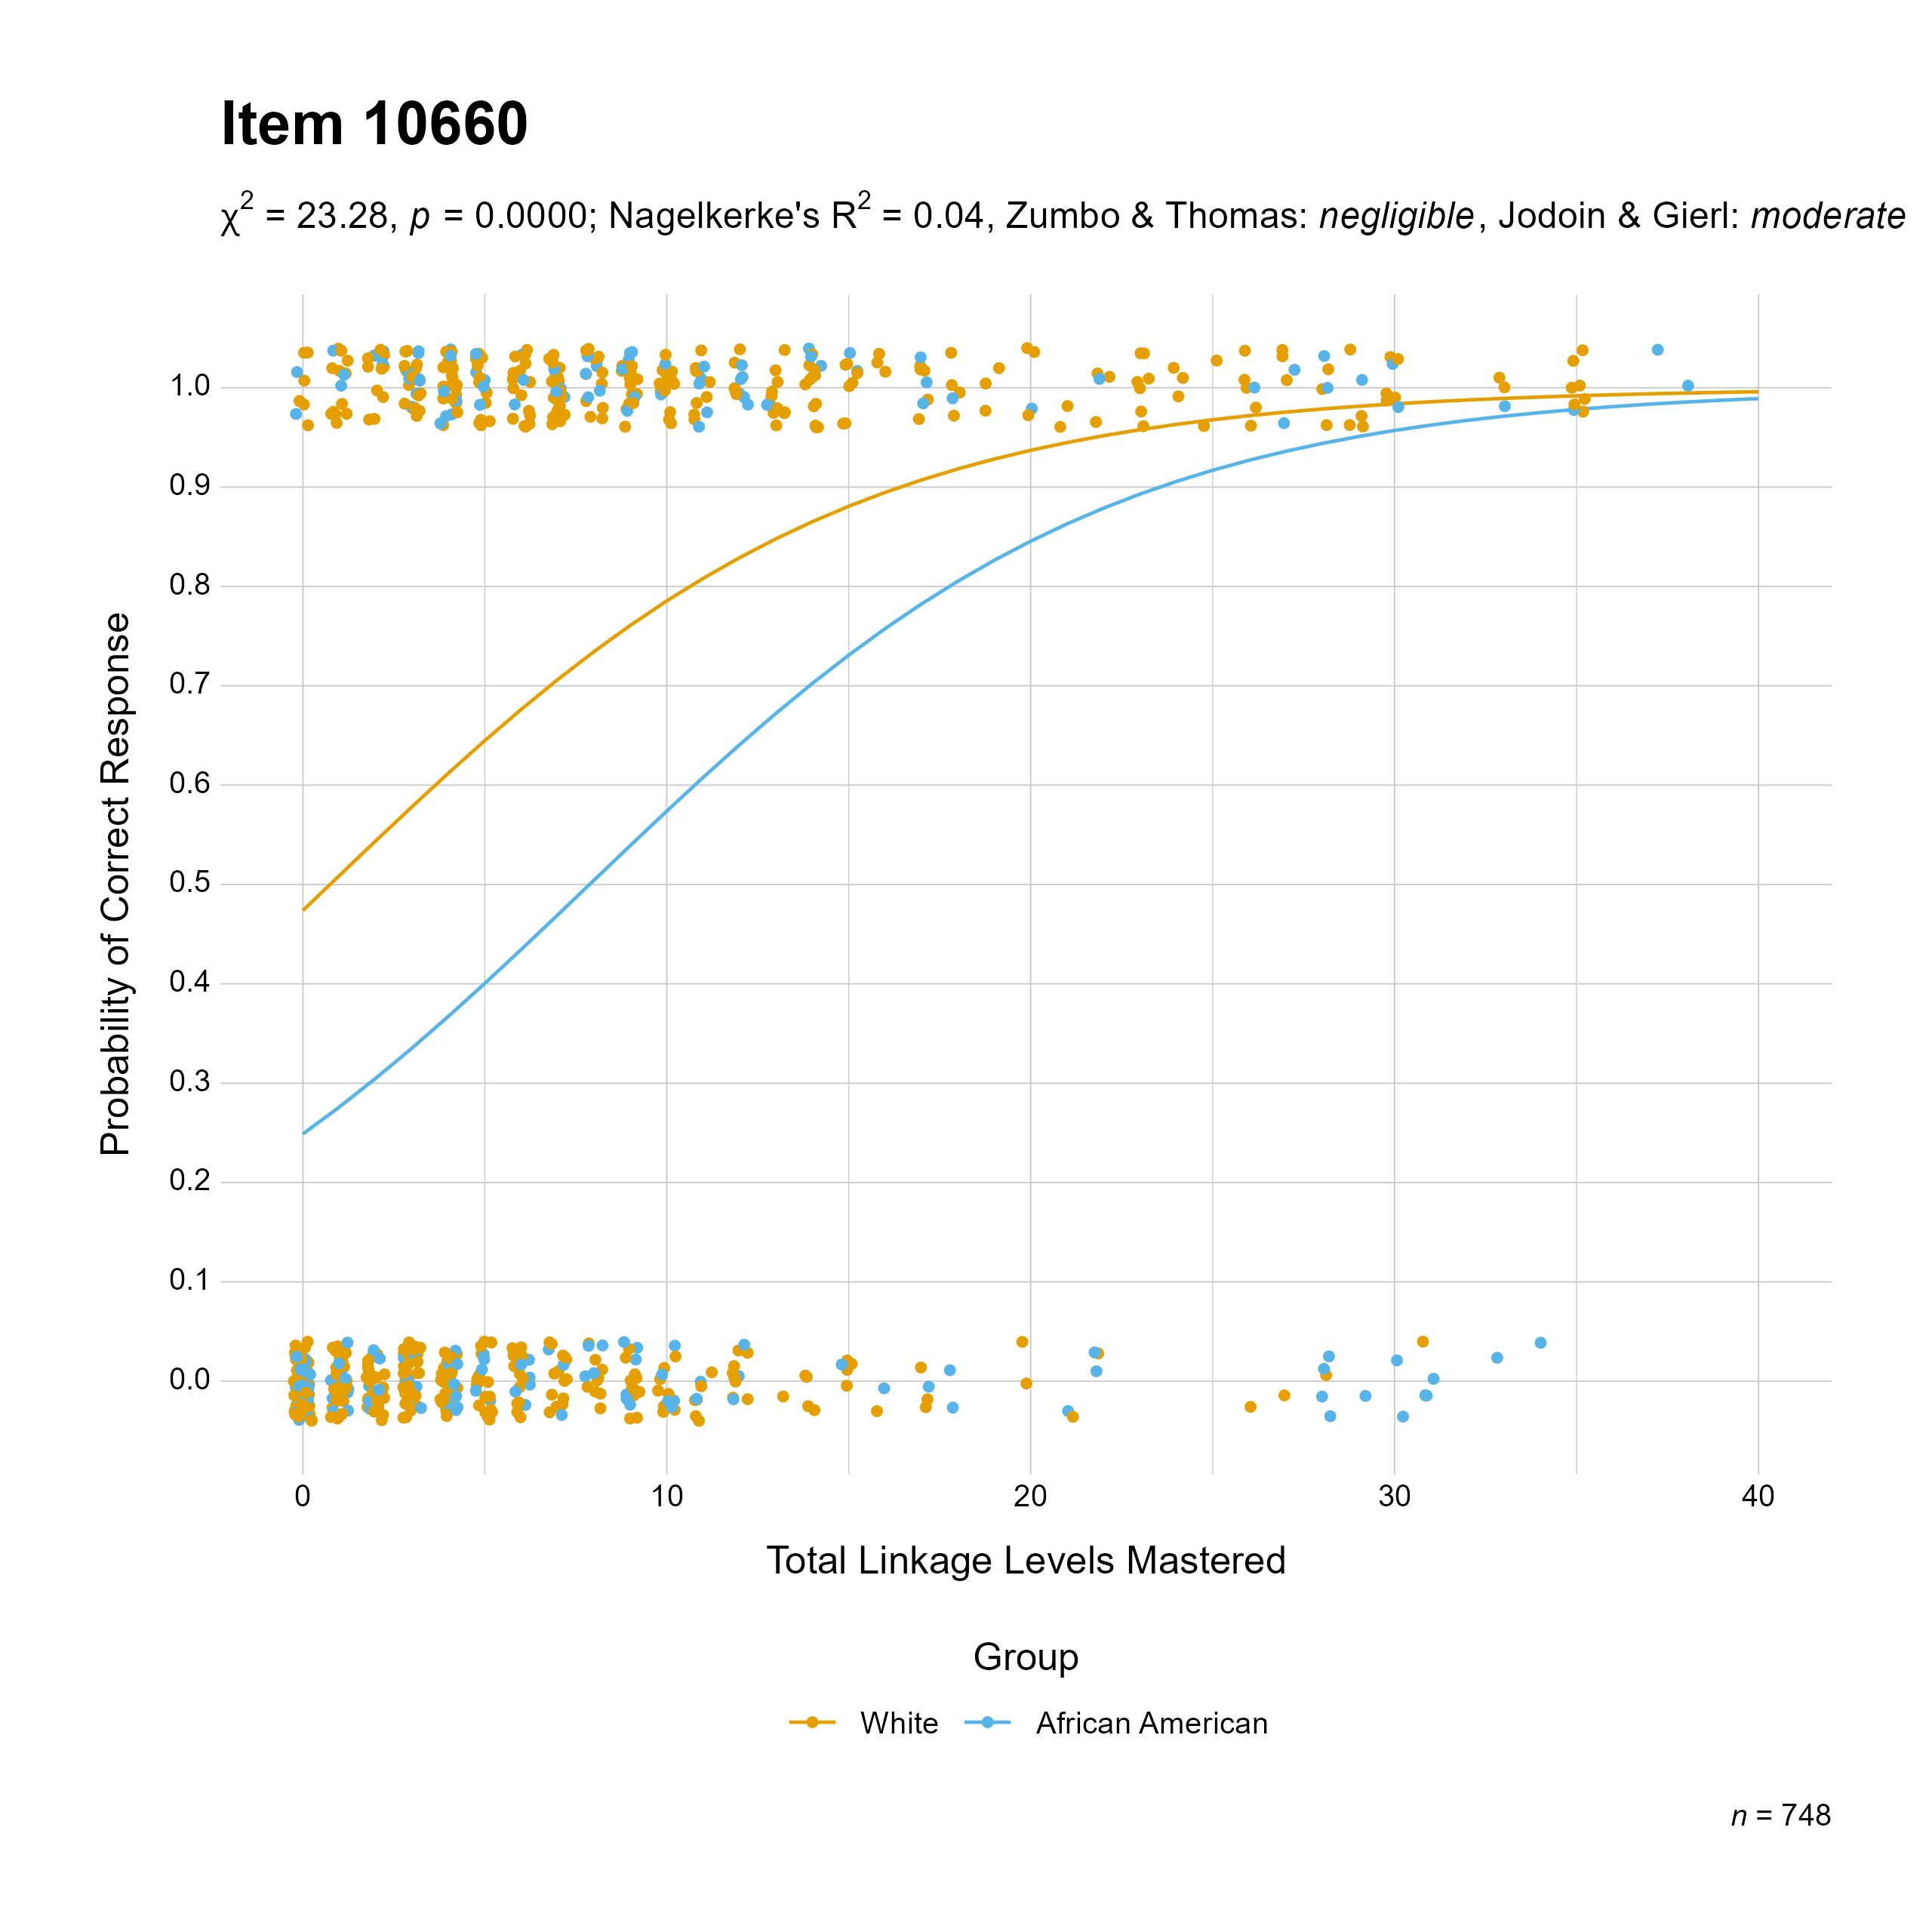
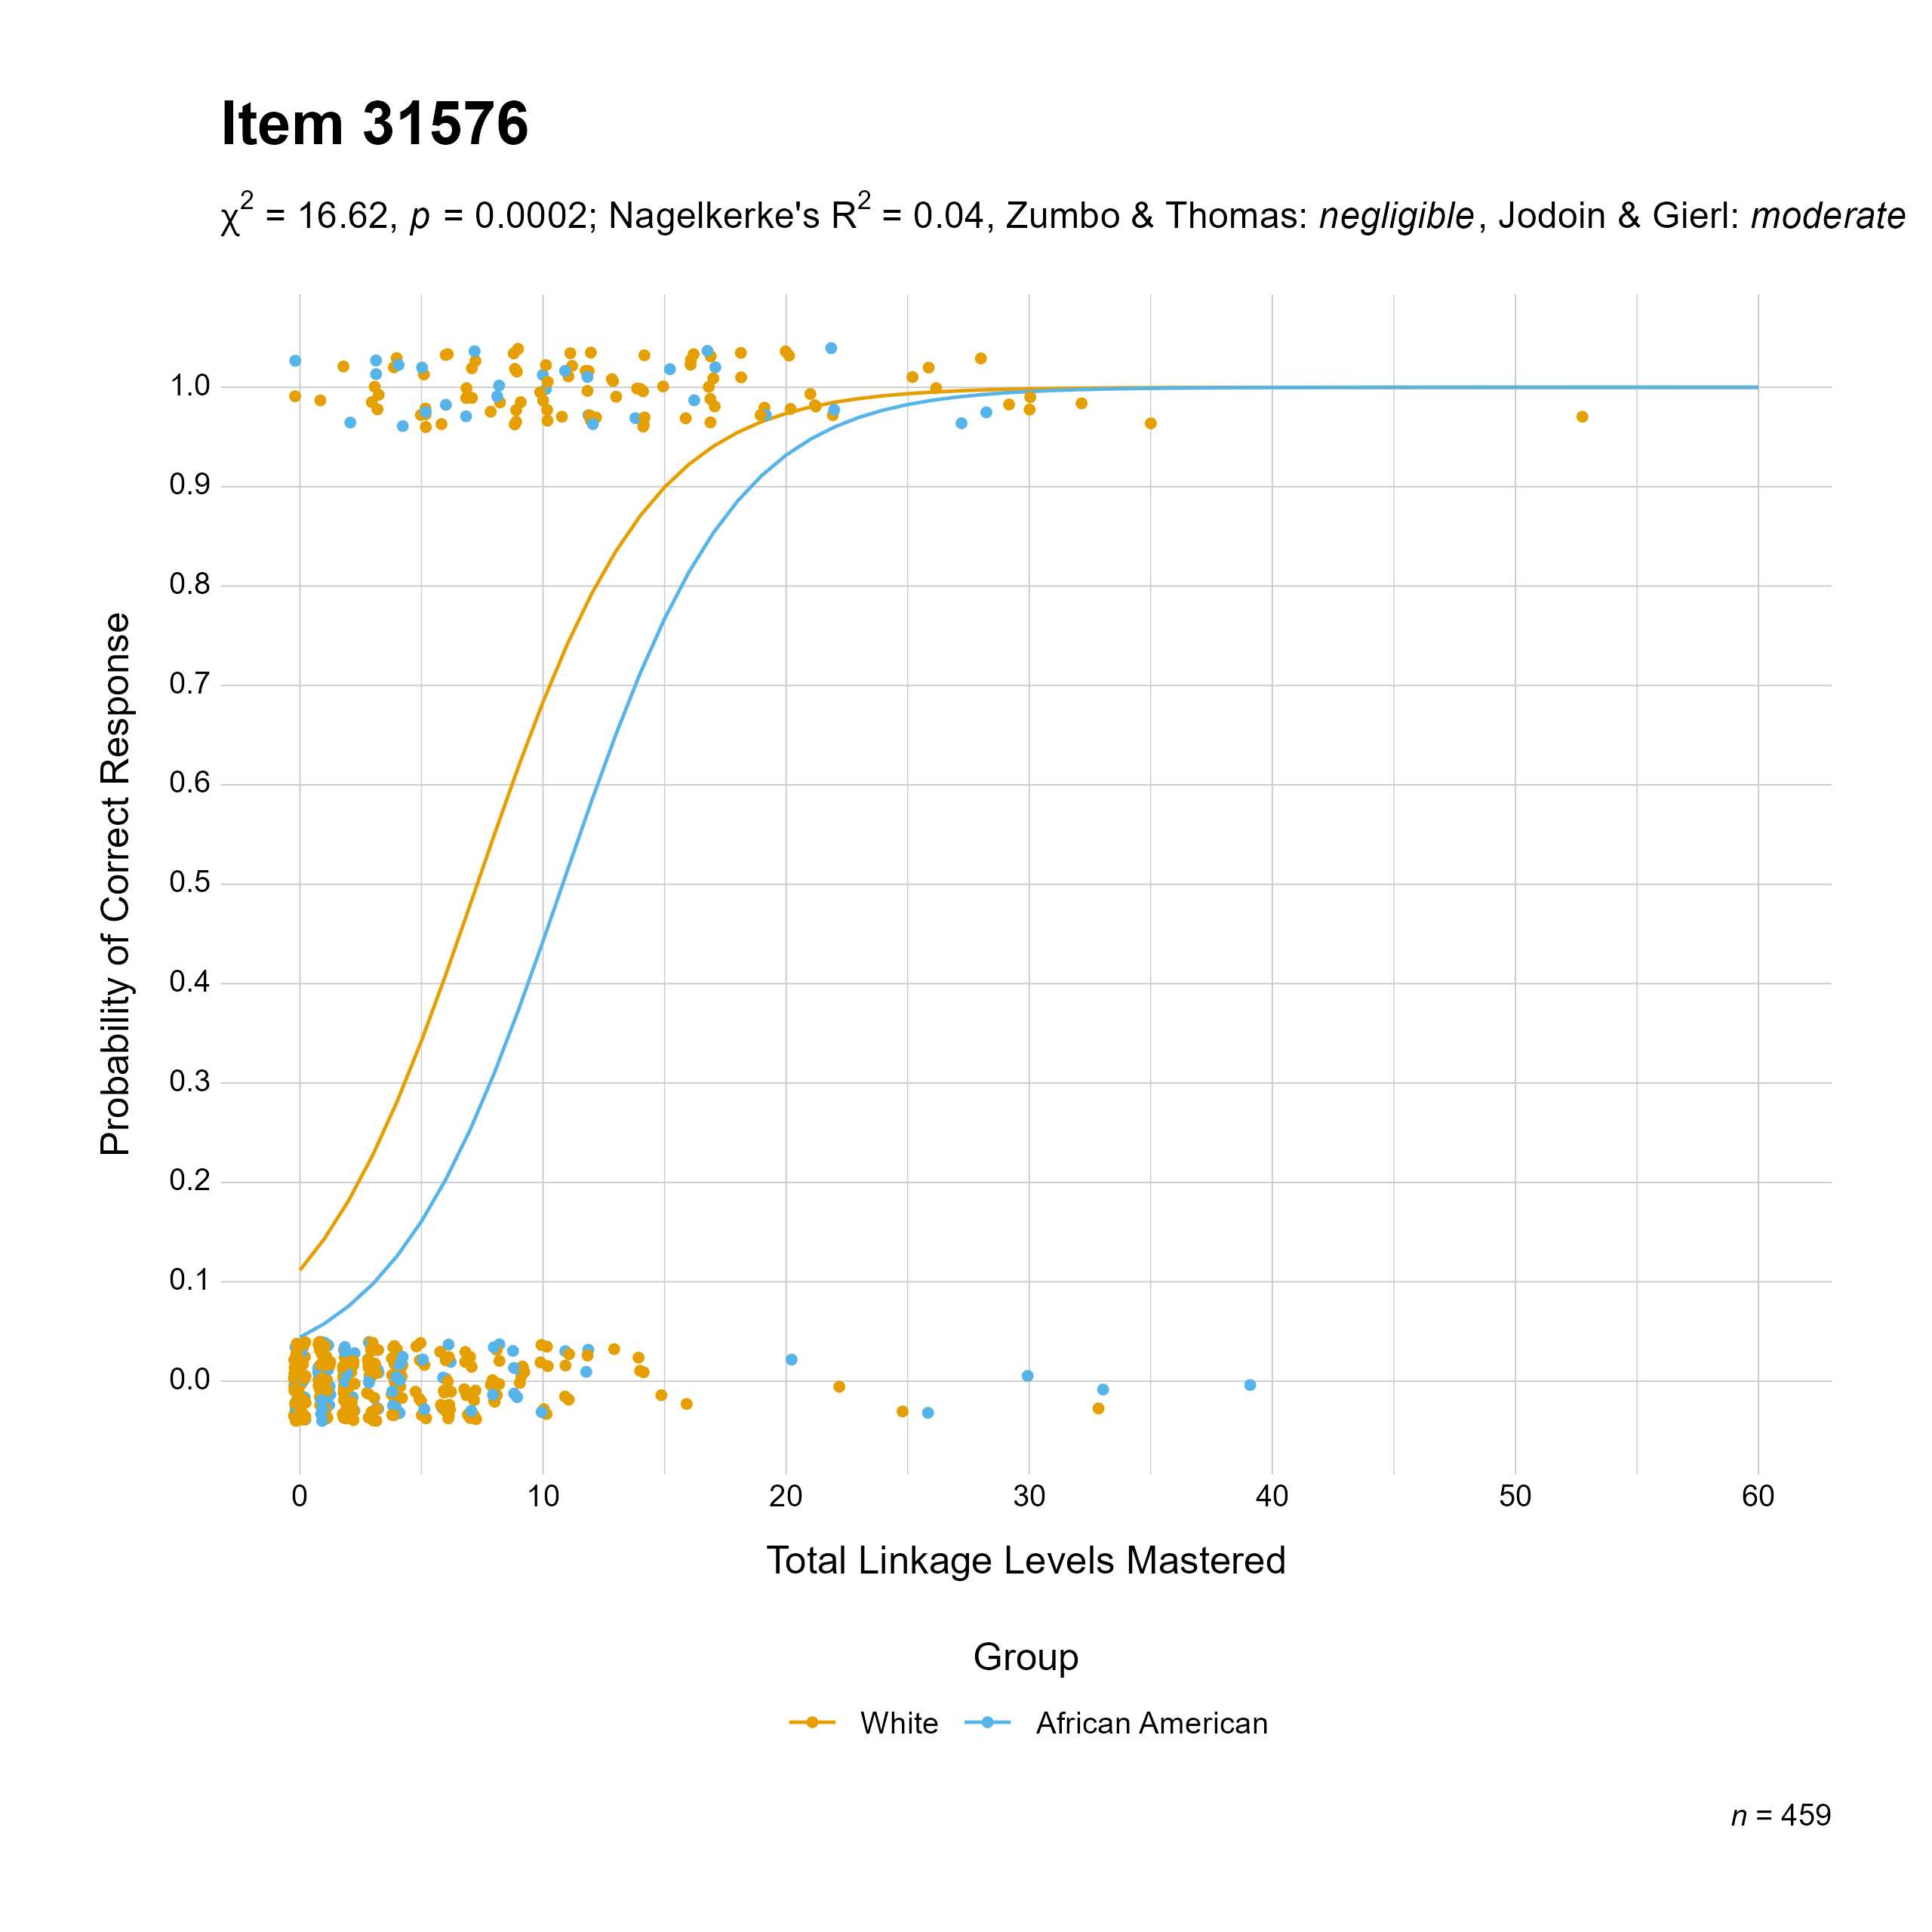
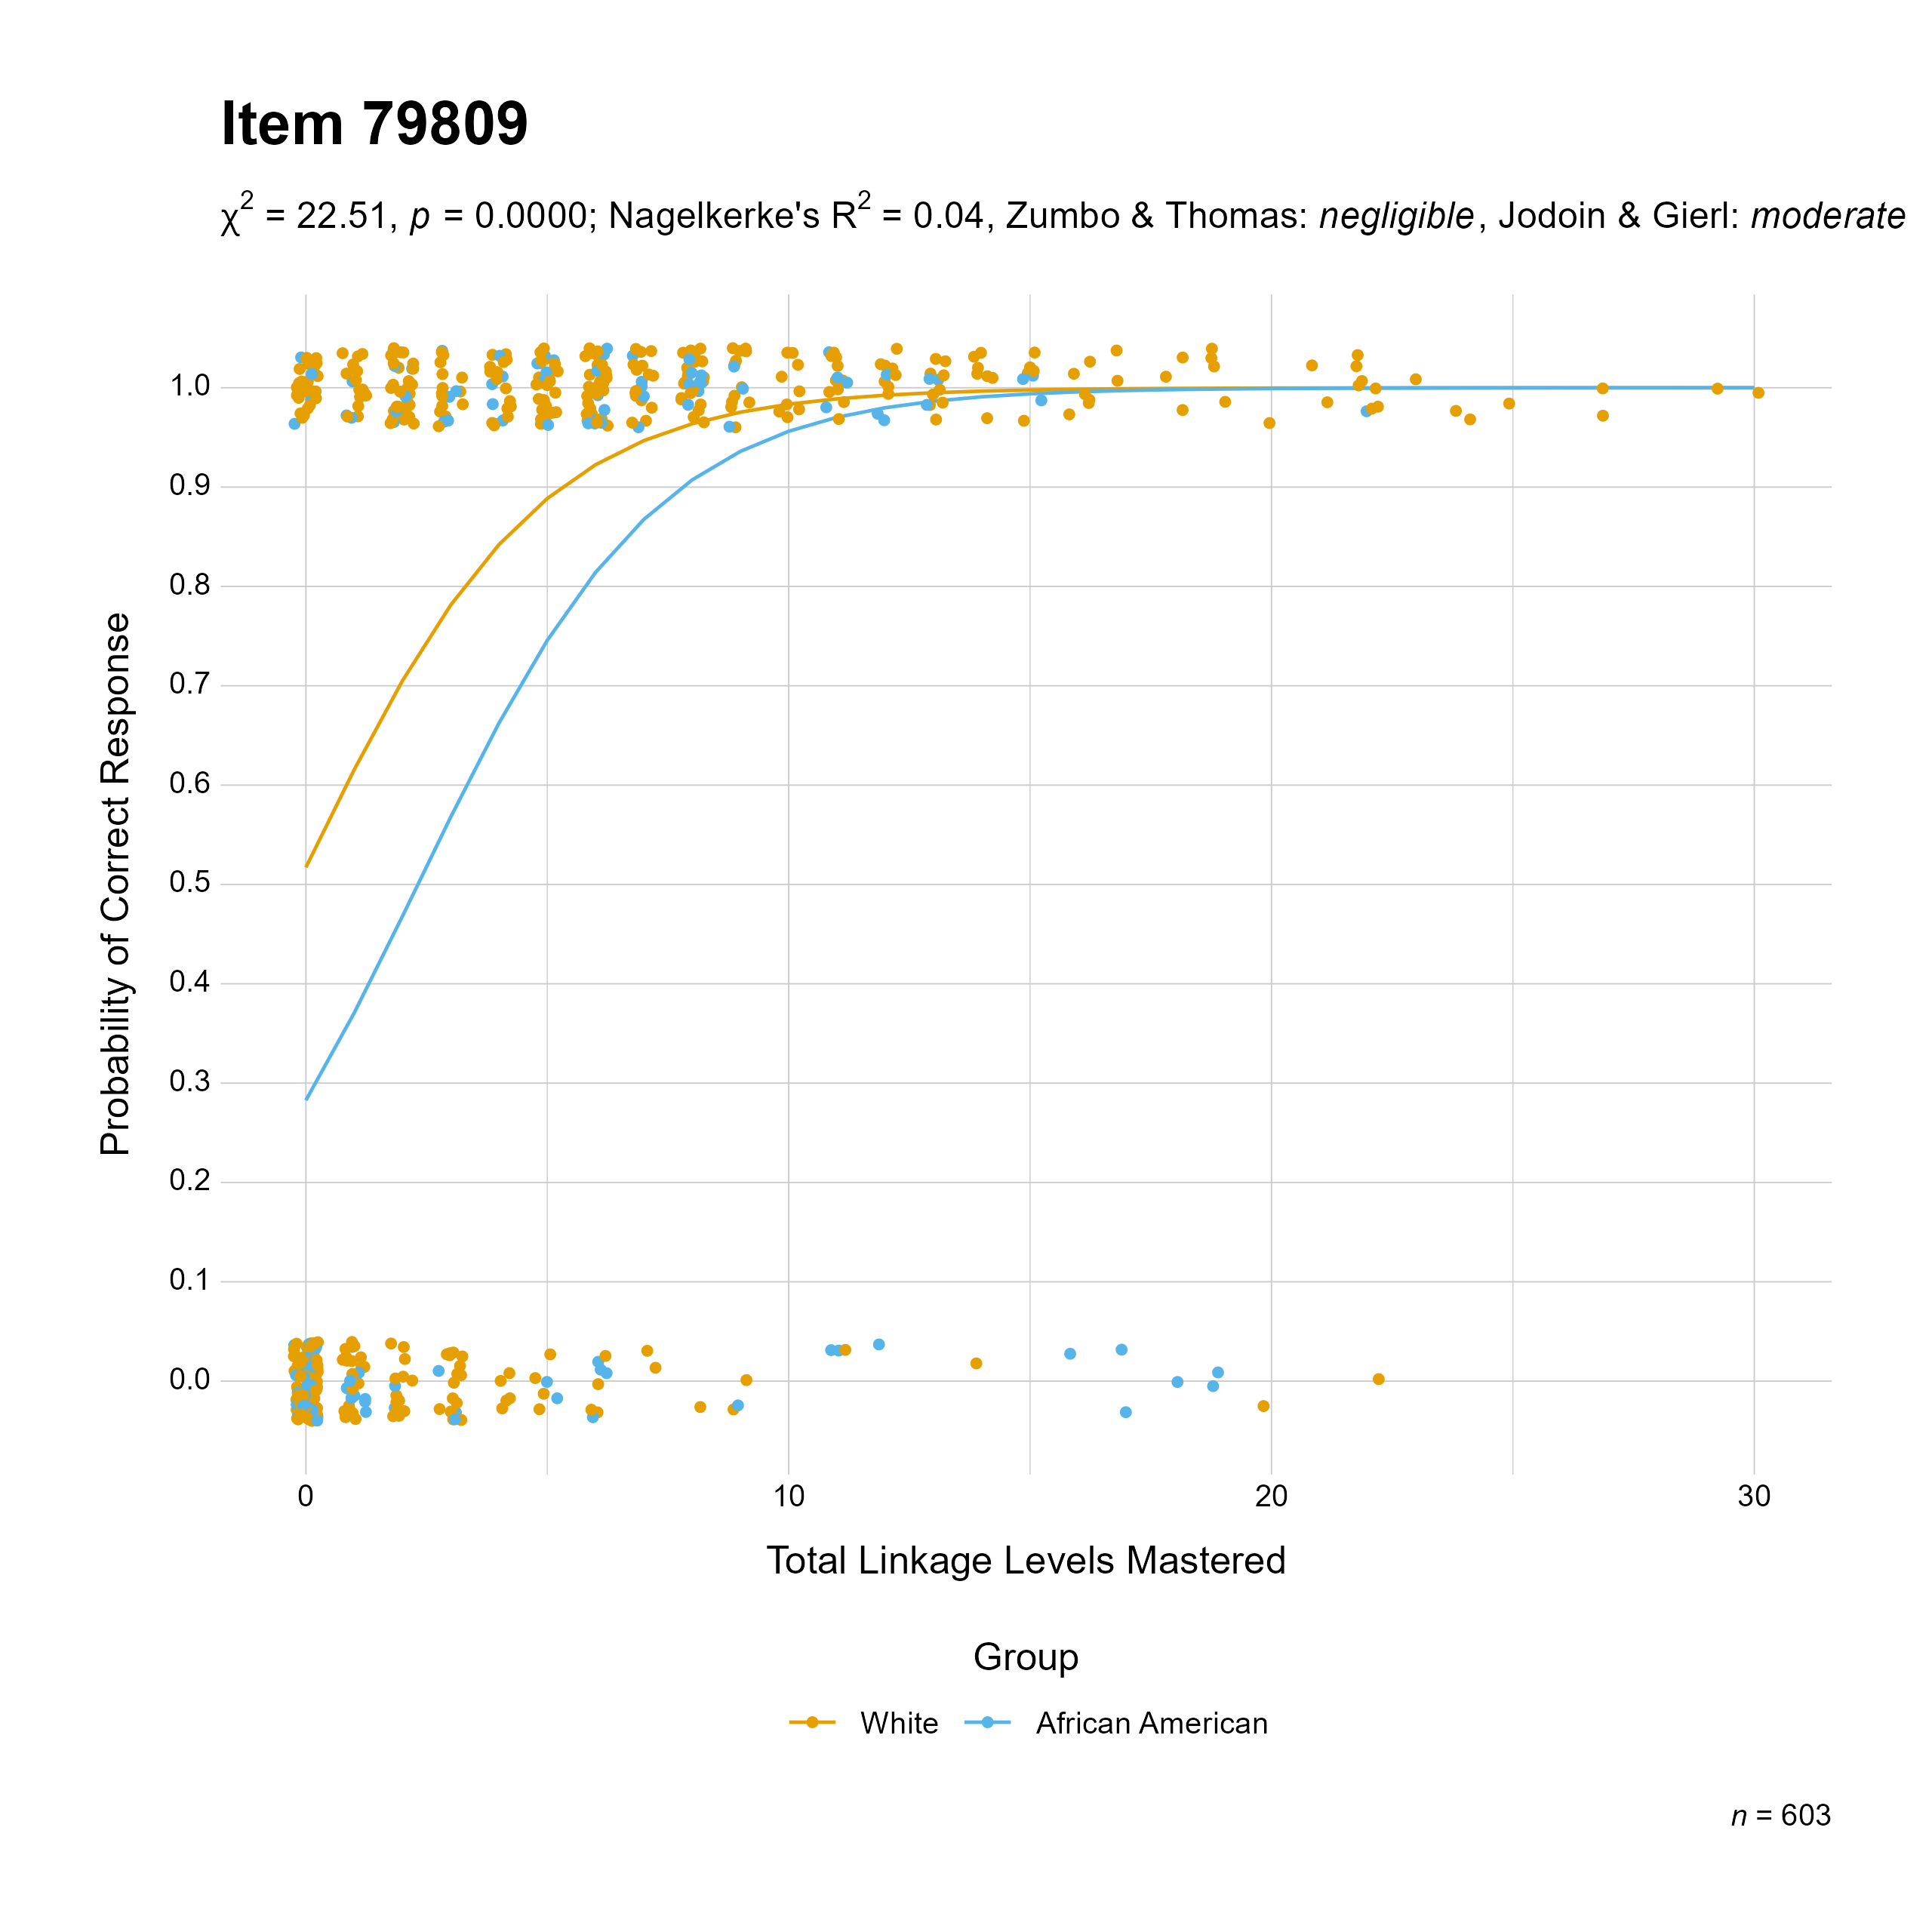
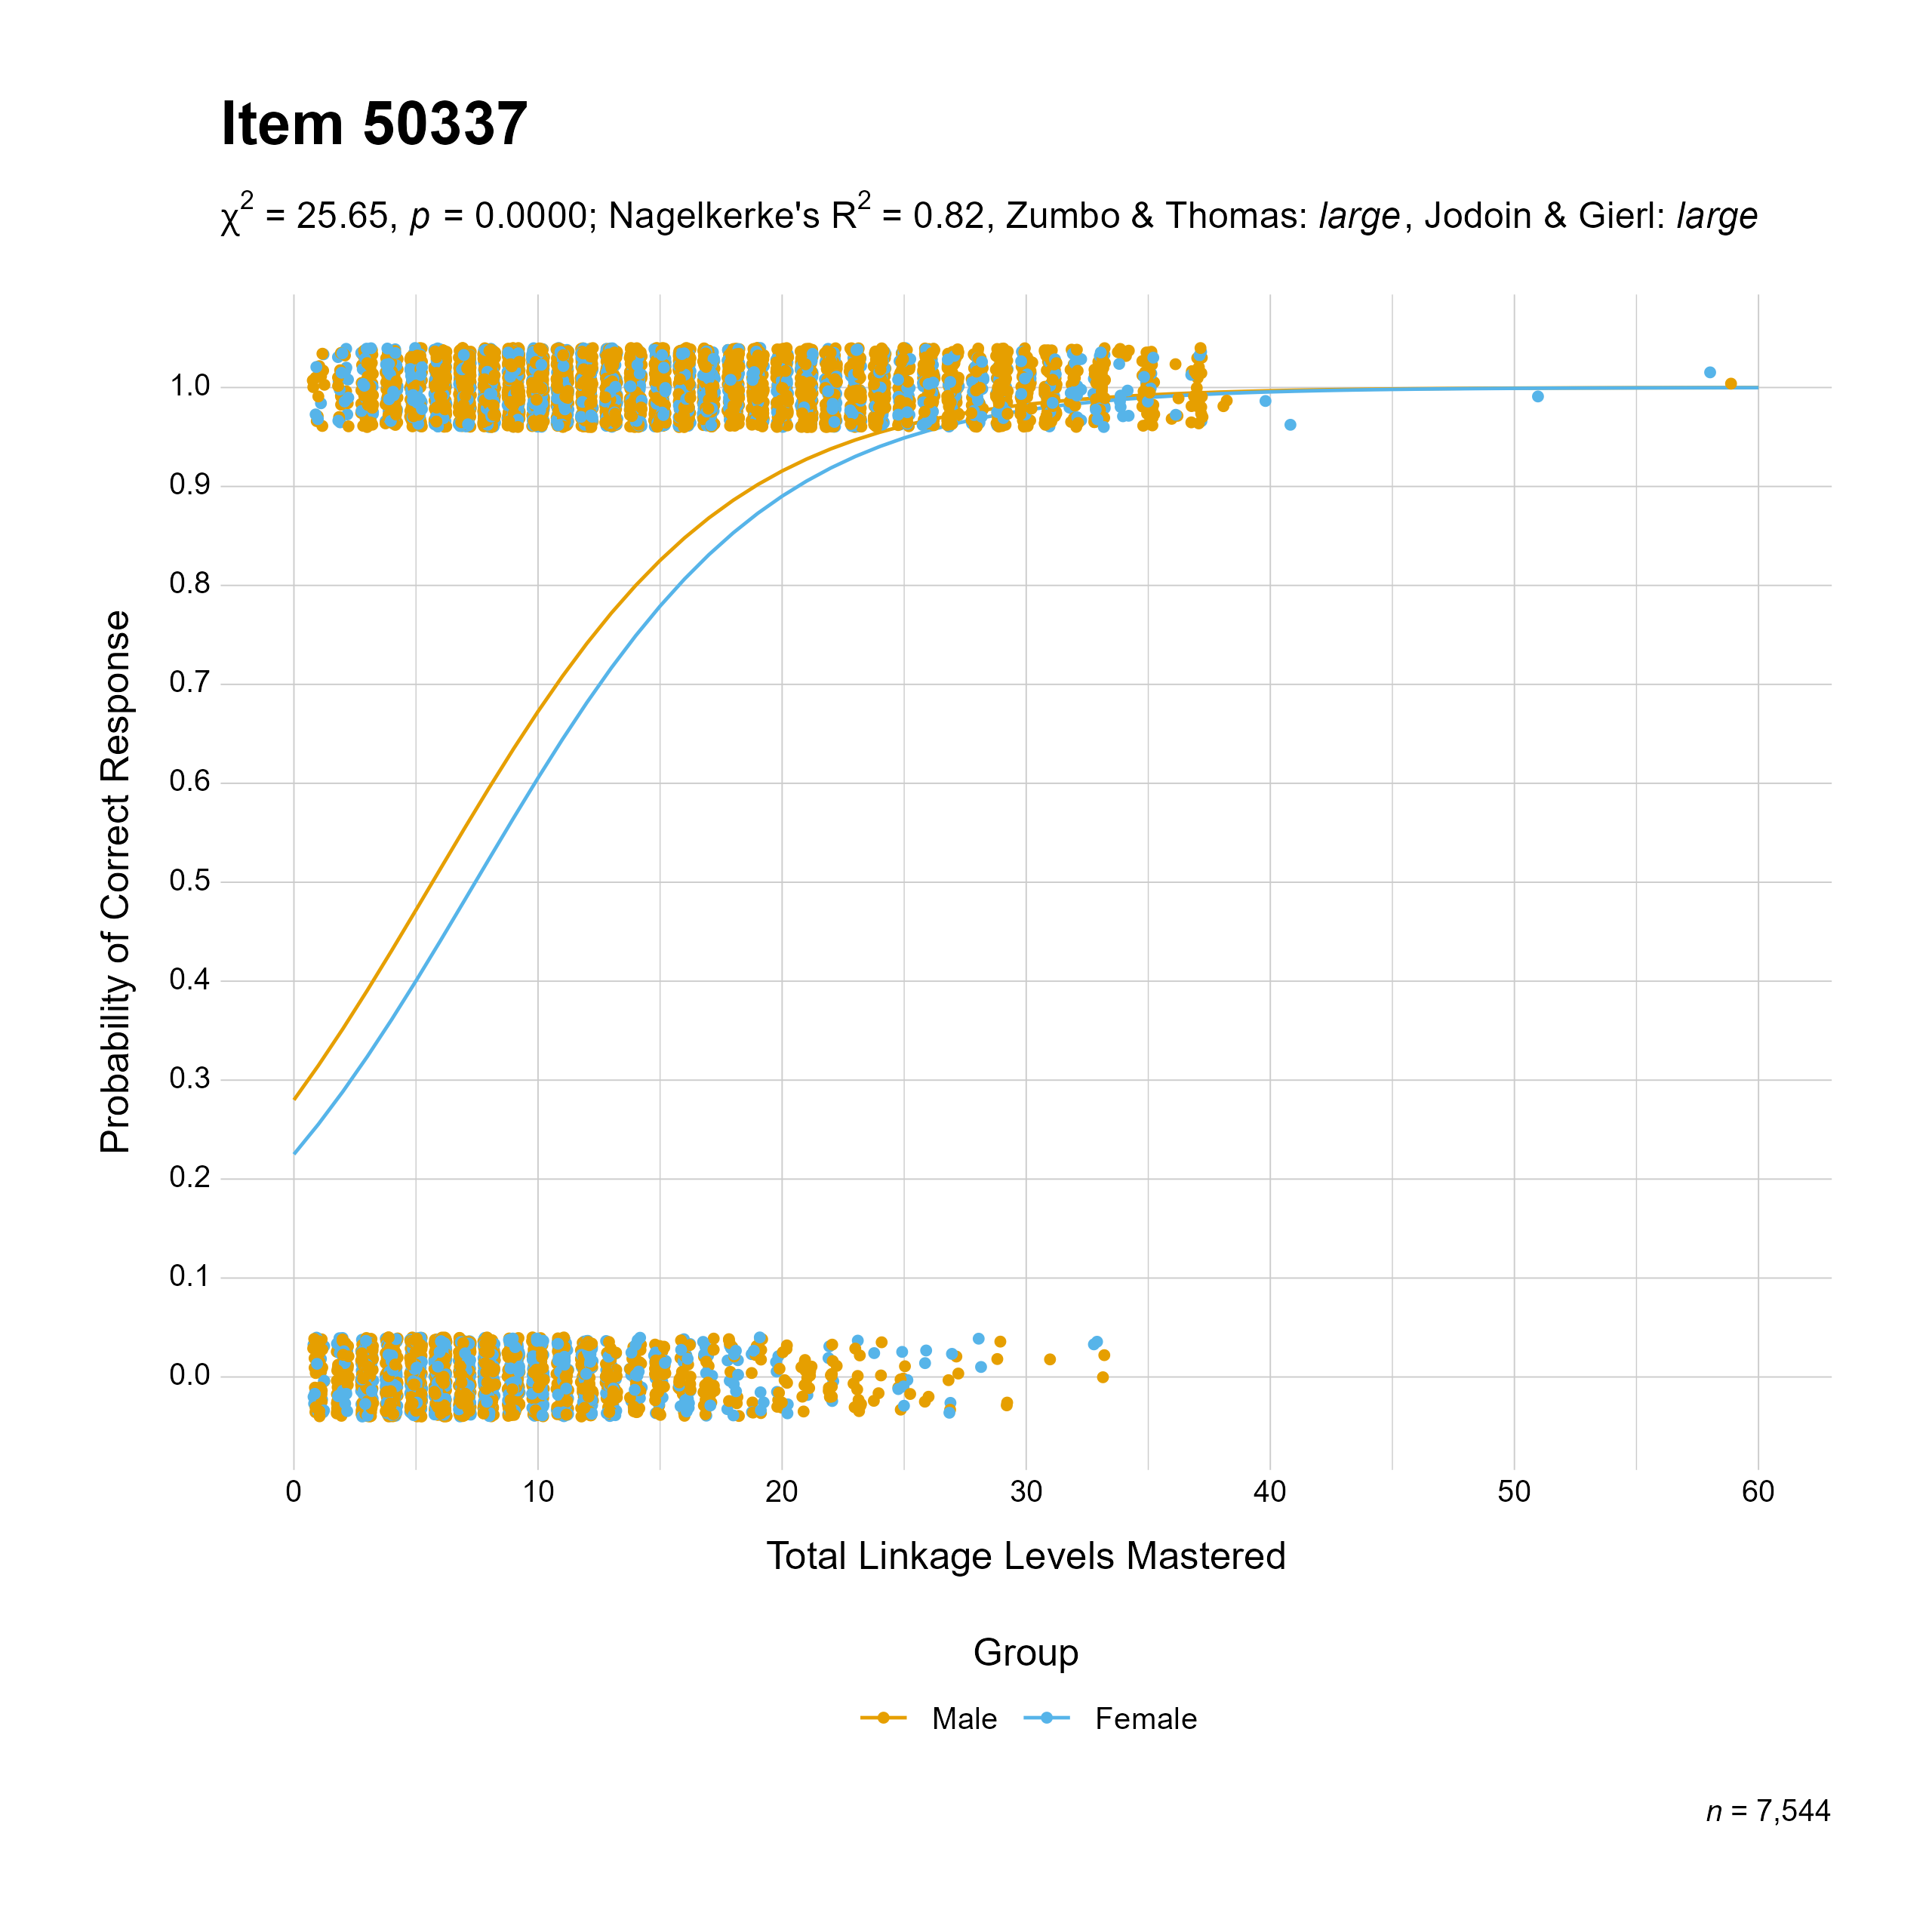
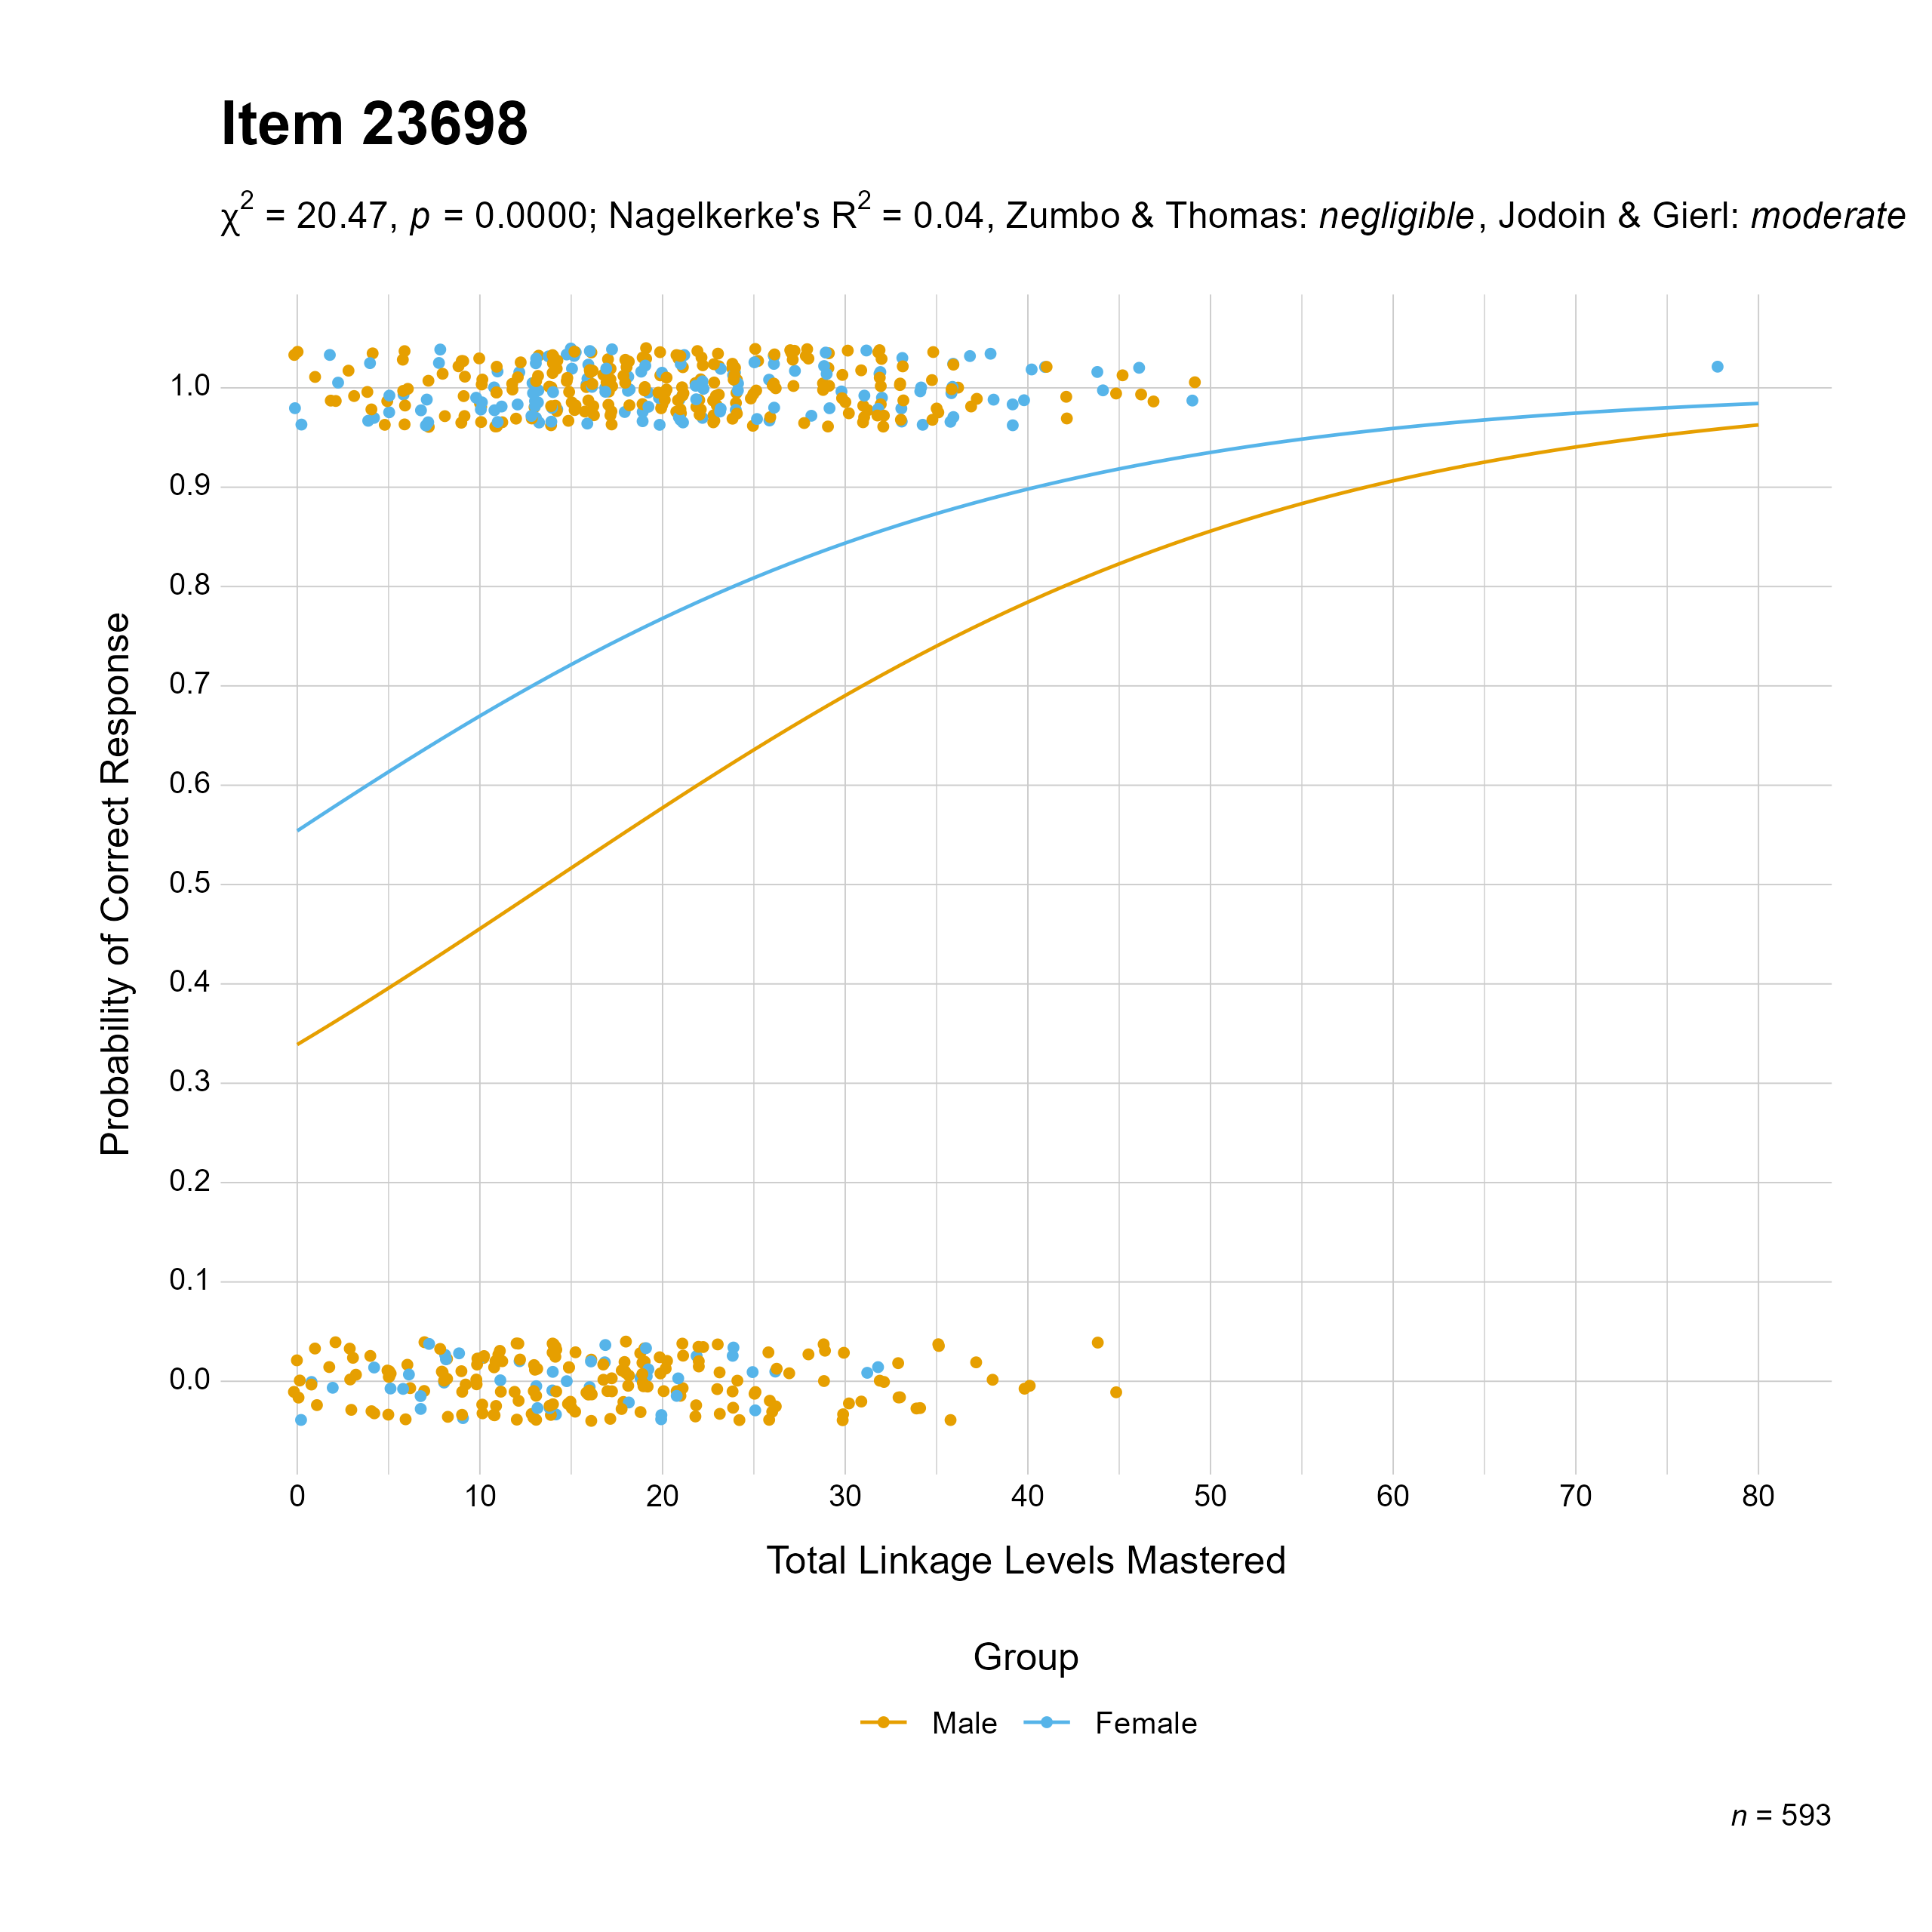
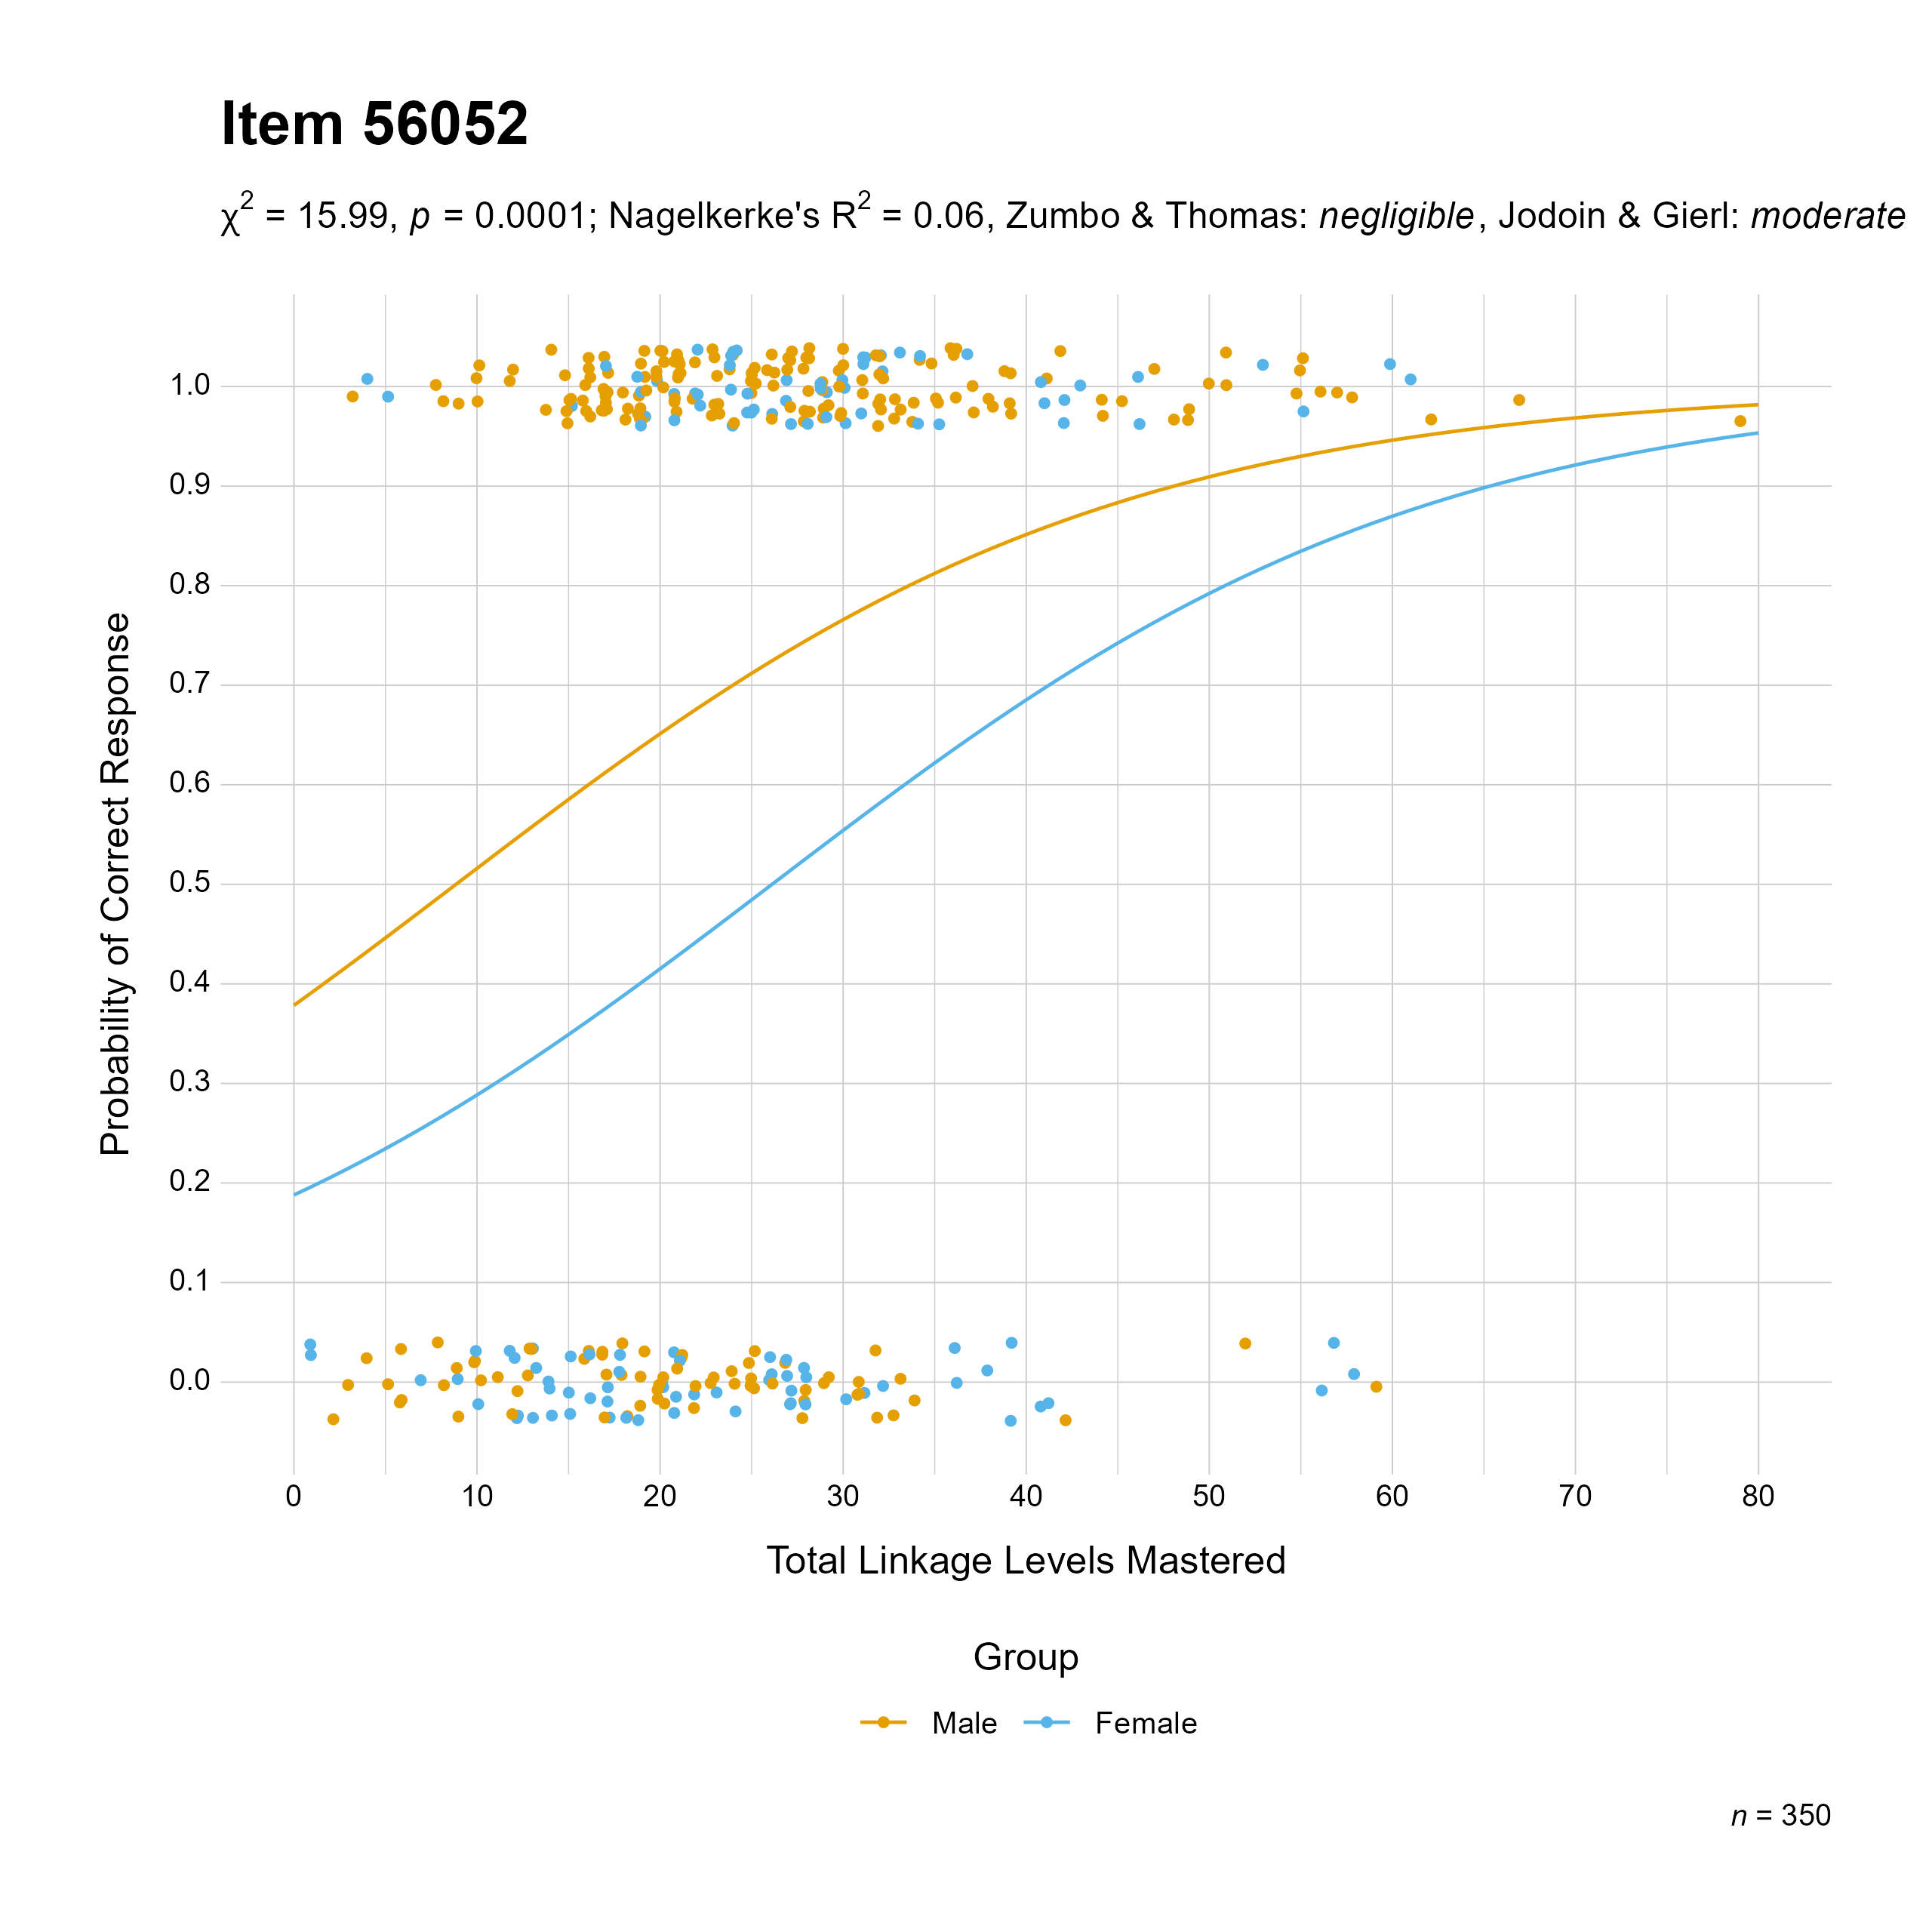
The plots in this section display the best-fitting regression line for each gender group, with jittered plots representing the total linkage levels mastered for individuals in each gender group. Plots are labeled with the item ID, and only items with non-negligible effect-size changes are included. The results from the uniform and combined logistic regression models are presented separately. For a full description of the analysis, see Chapter 3 of the 2021–2022 Technical Manual—Instructionally Embedded Model (Dynamic Learning Maps Consortium, 2022).
A.1.1 Uniform Model
These plots show items that had a non-negligible effect-size change when comparing the model that includes a predictor for the total linkage levels mastered to the model that includes a predictor for the total linkage levels mastered and a group membership variable. In this model, the probability of a correct response was modeled as a function of ability and group membership.
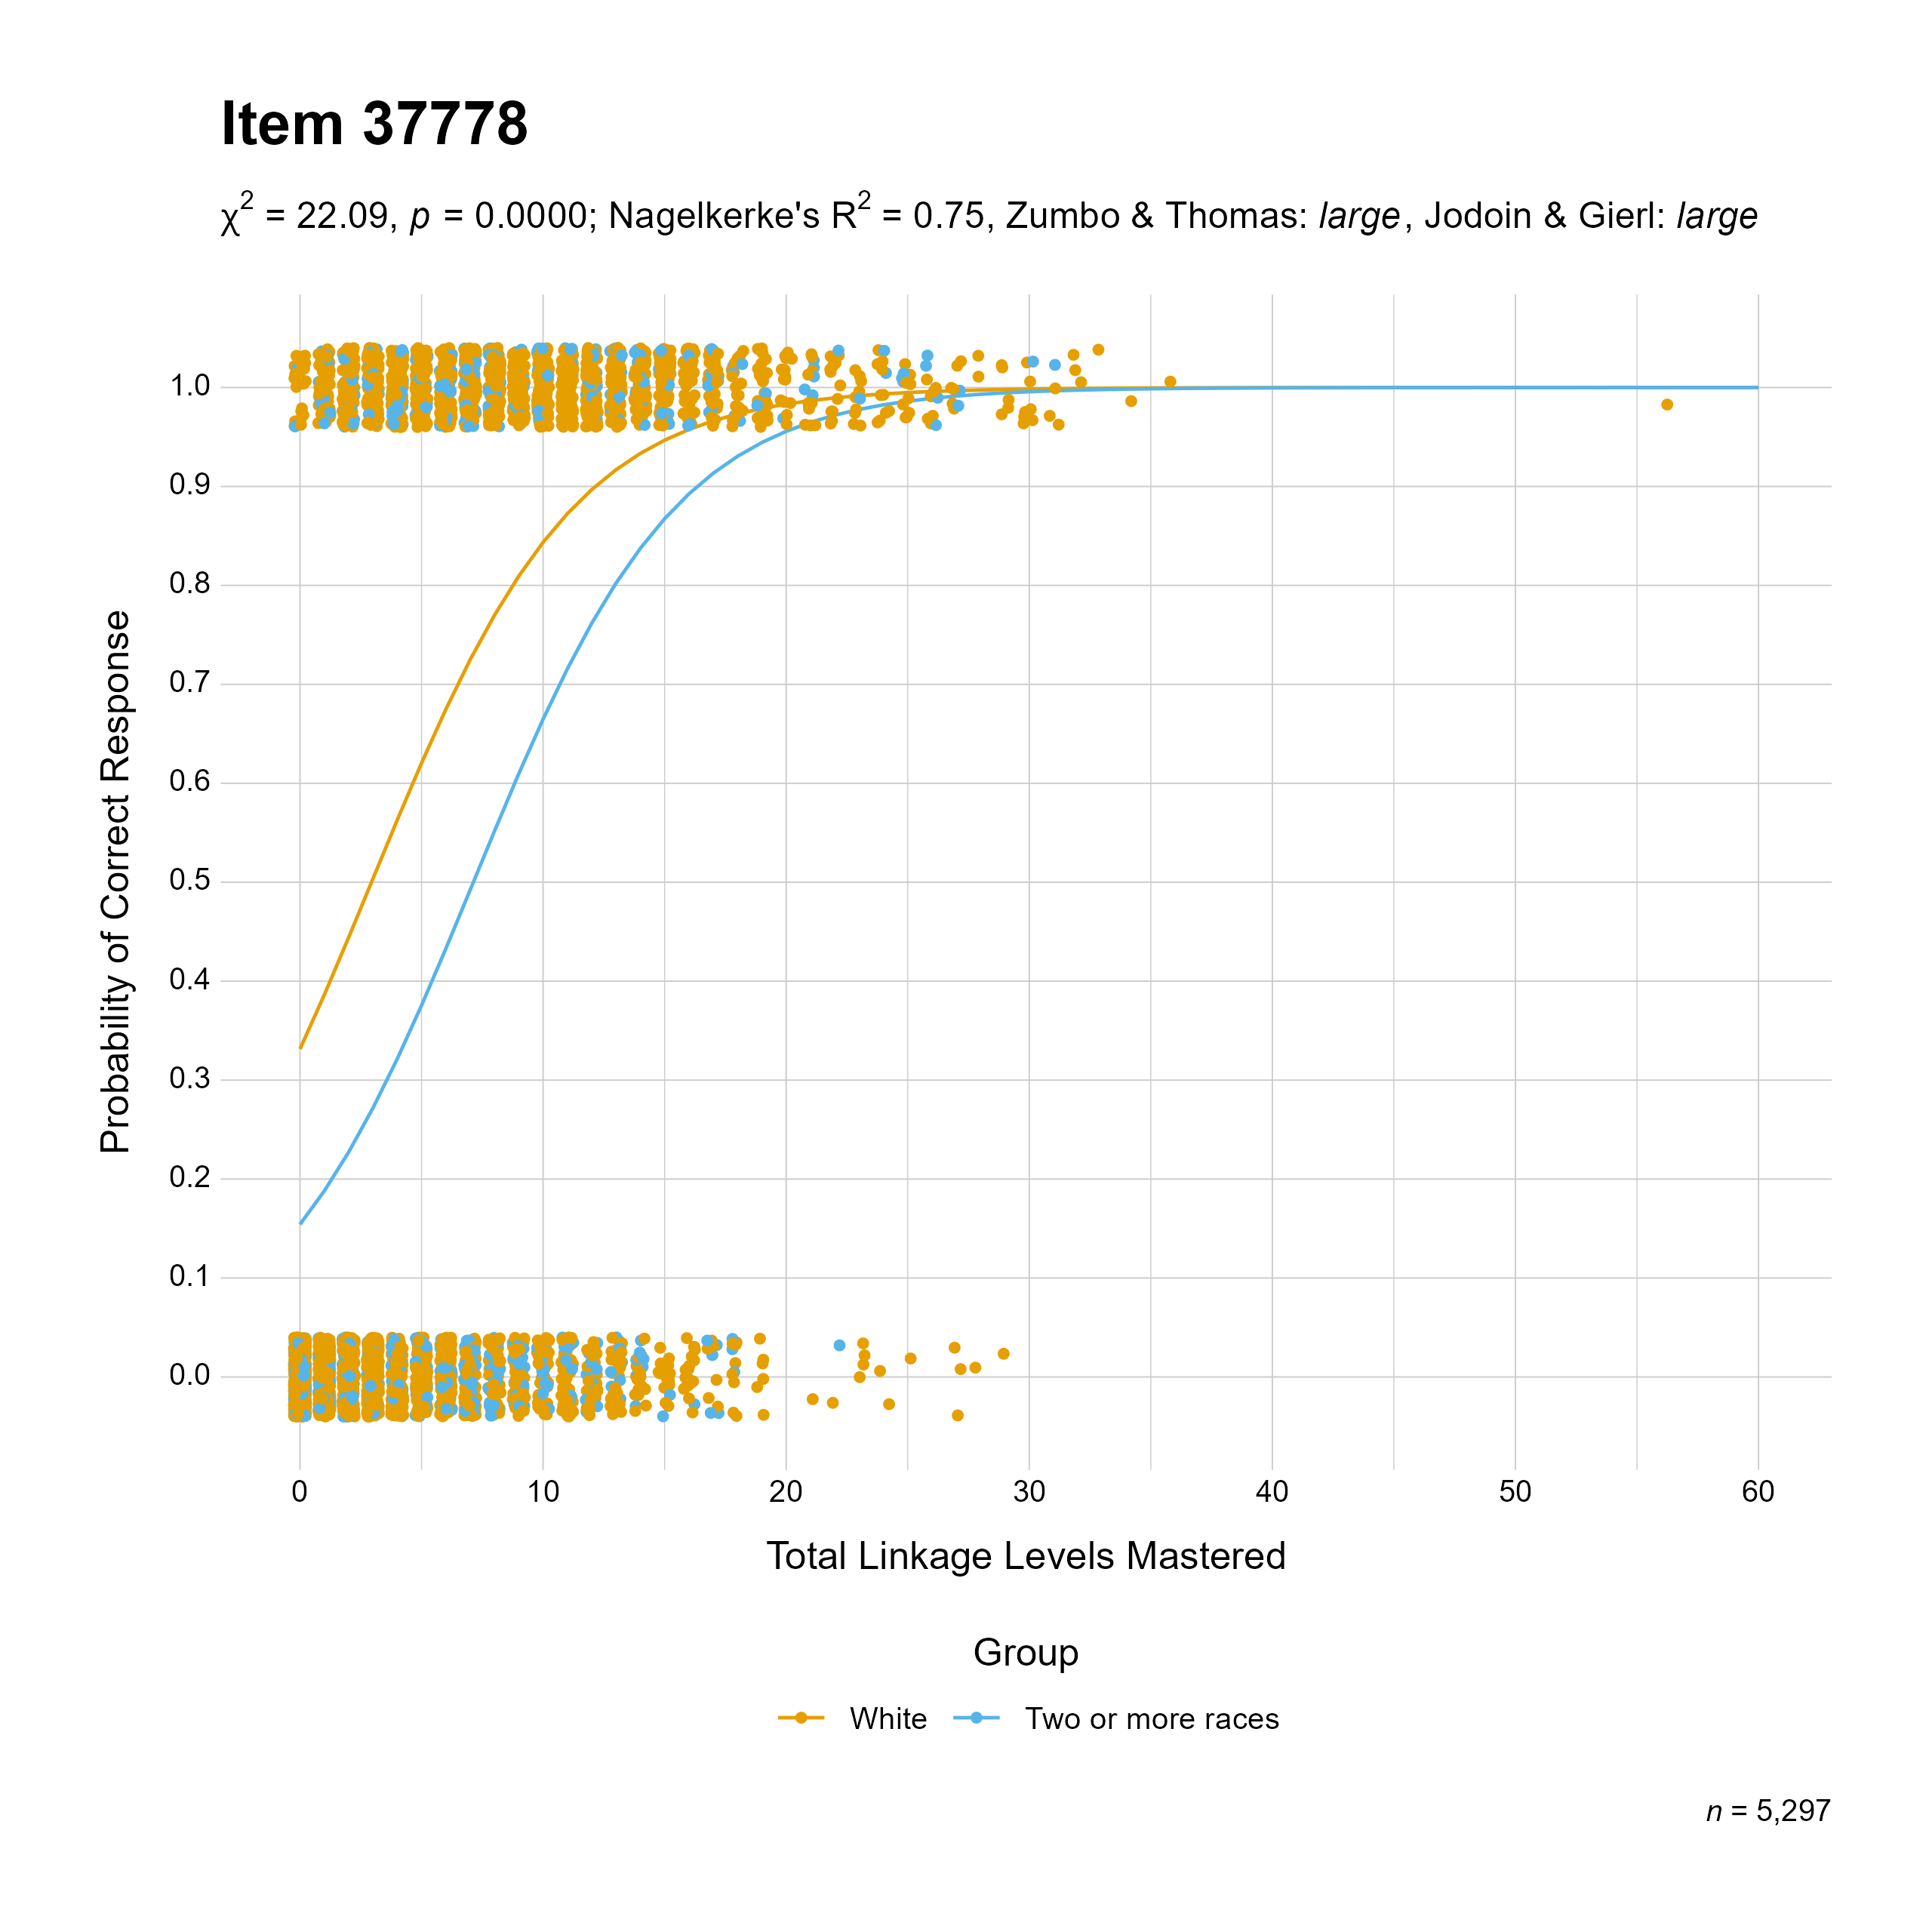
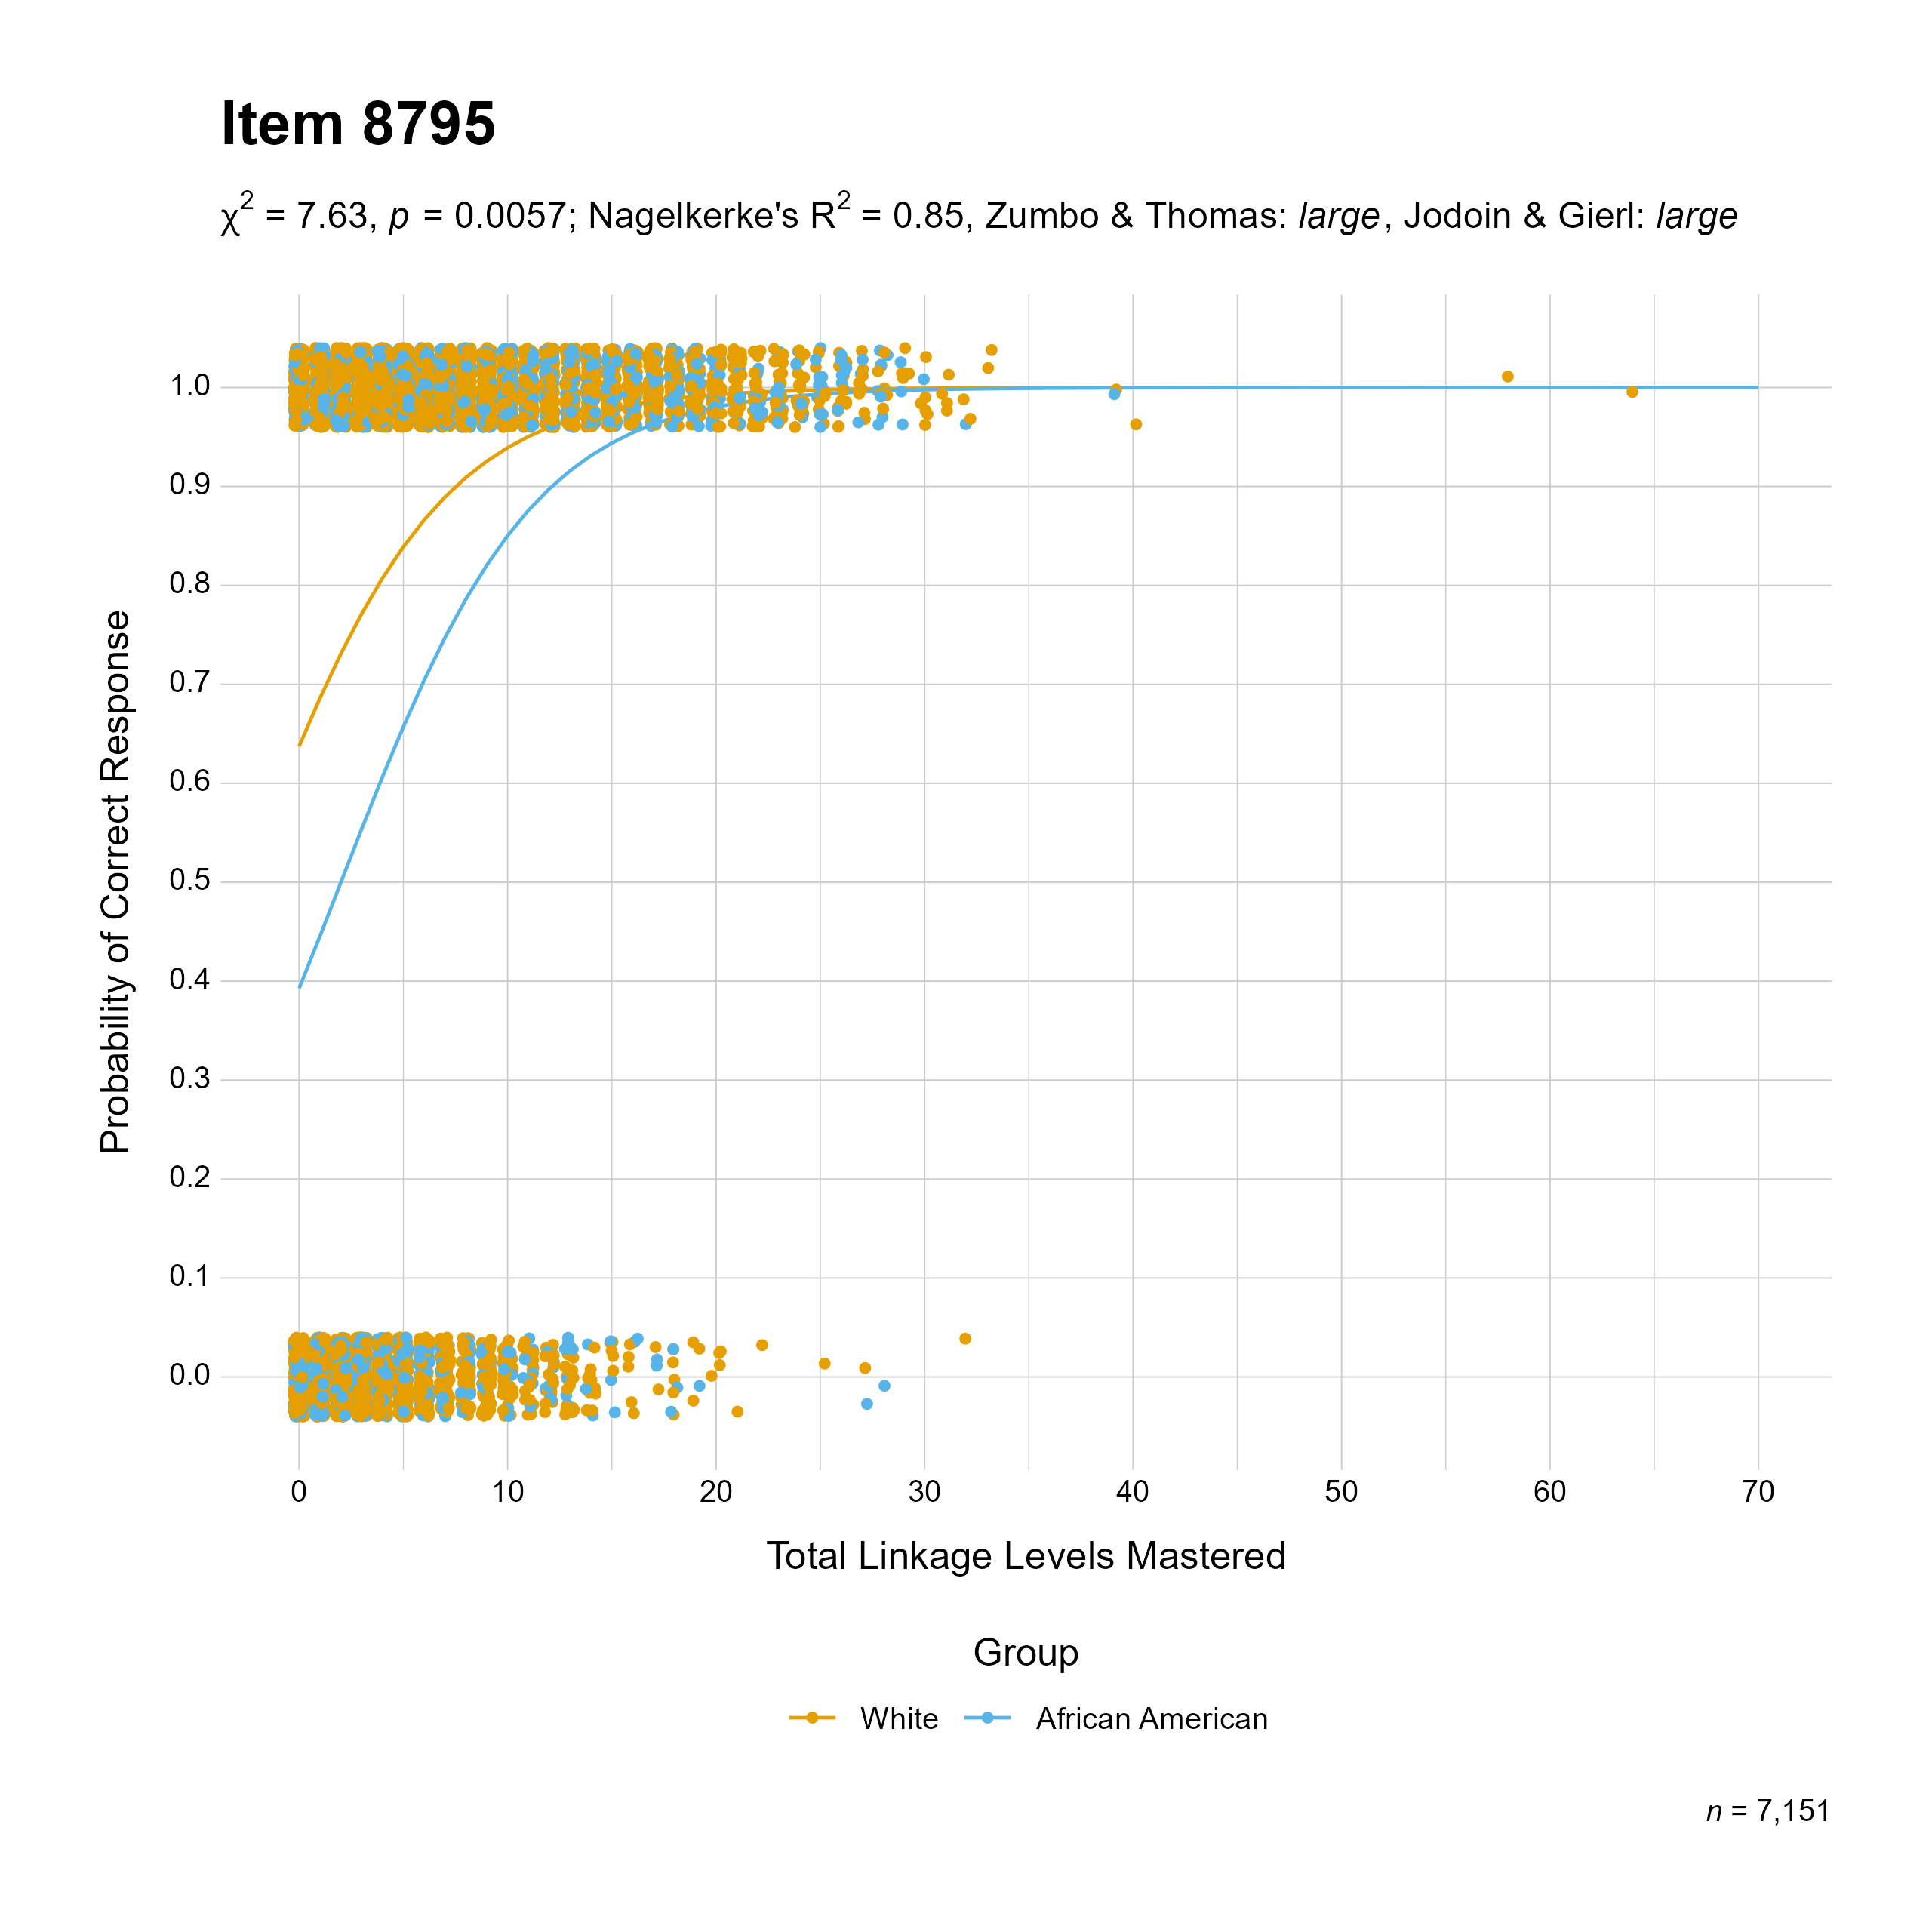
A.1.2 Combined Model
These plots show items that had a non-negligible effect-size change when comparing the model that includes a predictor for the total linkage levels mastered to the model that includes a predictor for the total linkage levels mastered, a group membership variable, and their interaction. In this model, the probability of a correct response was modeled as a function of ability, group membership, and their interaction.