4 Assessment Delivery
Chapter 4 of the Dynamic Learning Maps® (DLM®) Alternate Assessment System 2021–2022 Technical Manual—Instructionally Embedded Model (Dynamic Learning Maps Consortium, 2022) describes general test administration and monitoring procedures. This chapter describes updated procedures and data collected in 2024–2025, including a summary of blueprint coverage, linkage level selection, administration incidents, accessibility support selections, test administration observations, and test administrator survey responses regarding user experience and opportunity to learn, including new longitudinal analyses of response trends over time.
Overall, intended administration features remained consistent with the 2023–2024 implementation, including the use of instructionally embedded assessment in both the fall and spring windows and the availability of accessibility supports.
For a complete description of test administration for DLM assessments—including information on the Kite® Suite used to assign and deliver assessments, testlet formats, accessibility features, the First Contact Survey used to recommend testlet linkage level, available administration resources and materials, and information on monitoring assessment administration—see the 2021–2022 Technical Manual—Instructionally Embedded Model (Dynamic Learning Maps Consortium, 2022).
4.1 Overview of Key Features of the Instructionally Embedded Assessment Model
As briefly described in Chapter 1, the DLM assessment system has two available models. This manual describes the Instructionally Embedded assessment model. Consistent with the DLM Theory of Action described in Chapter 1, the DLM assessment administration features reflect multidimensional, nonlinear, and diverse ways that students learn and demonstrate their learning. Test administration procedures therefore use multiple sources of information to assign testlets, including student characteristics, prior performance, and educator judgment.
In the Instructionally Embedded model, the DLM system is designed to assess student learning throughout the year and features flexibility in the choice of assessment content to support the timely use of data to inform instructional planning. Test administrators use the Instruction and Assessment Planner in Educator Portal to administer instructionally embedded testlets. Each testlet is administered after instruction in fall and spring testing windows so that testing informs teaching and students’ learning. This assessment model yields summative results based on all instructionally embedded assessments administered across both windows.
With the exception of English language arts (ELA) writing testlets, each testlet contains items measuring one Essential Element (EE) and one linkage level. In reading and mathematics, items in a testlet are aligned to nodes at one of five linkage levels for a single EE. Writing testlets measure multiple EEs and are delivered at one of two levels: emergent (which corresponds with Initial Precursor and Distal Precursor linkage levels) or conventional (which corresponds with Proximal Precursor, Target, and Successor linkage levels).
For a complete description of key administration features, including information on assessment delivery, the Kite Suite, the Instruction and Assessment Planner, and linkage level selection, see Chapter 4 of the 2021–2022 Technical Manual—Instructionally Embedded Model (Dynamic Learning Maps Consortium, 2022). Additional information about changes in administration can also be found in the Test Administration Manual (Dynamic Learning Maps Consortium, 2025d) and the Educator Portal User Guide (Dynamic Learning Maps Consortium, 2025c).
4.1.1 Assessment Administration Windows
Testlets are administered in two assessment administration windows: fall and spring.
4.1.1.1 Fall Window
Test administrators use blueprint coverage criteria for both ELA and mathematics to decide which Essential Elements (EEs) and linkage levels to assess for each student throughout the fall window. In 2024–2025, the fall window occurred between September 9, 2024, and December 20, 2024. States were given the option of using the entire window or setting their own dates within the larger window. Across all states, the fall window ranged from 11 to 15 weeks.
4.1.1.2 Spring Window
Test administrators use the same blueprint coverage criteria to make EE and linkage level selections for the spring window. They can choose, teach, and assess the same EEs and linkage levels as the fall window, or they can choose different EEs and/or linkage levels. In 2024–2025, the spring window occurred between February 3, 2025, and May 16, 2025. States were given the option of using the entire window or setting their own dates within the larger window. Across all states, the spring window ranged from 12 to 15 weeks.
4.2 Evidence From the DLM System
This section describes evidence collected by the DLM system during the 2024–2025 operational administration of the DLM alternate assessment. The categories of evidence include blueprint coverage, test administrator selection of linkage levels, administration incidents, accessibility support selections, and participation by nonsymbolic communicators.
4.2.1 Blueprint Coverage
Test administrators selected the EEs for their students to test on from among those available on the ELA and mathematics blueprints in both the fall and spring windows. Table 4.1 summarizes the number of EEs required to meet blueprint coverage and the total number of EEs available for instructionally embedded assessments for each grade and subject. Consistent with prior years, a total of 255 EEs (148 in ELA and 107 in mathematics) for grades 3 through high school were available; 21,134 students in those grades participated in the fall window, and 21,761 students participated in the spring window. Histograms in Appendix B.1 summarize the distribution of total unique EEs assessed per student in each grade and subject.
|
English language arts
|
Mathematics
|
|||
|---|---|---|---|---|
| Grade | Expected (n) | Available (N) | Expected (n) | Available (N) |
| 3 | 8 | 17 | 6 | 11 |
| 4 | 9 | 17 | 8 | 16 |
| 5 | 8 | 19 | 7 | 15 |
| 6 | 9 | 19 | 6 | 11 |
| 7 | 11 | 18 | 7 | 14 |
| 8 | 11 | 20 | 7 | 14 |
| 9–10 | 10 | 19 | 6 | 26 |
| 11–12 | 10 | 19 | — | — |
| Note. High school mathematics is reported in the Grade 9–10 row. There were 26 EEs available for the 9–11 grade band. While EEs were assigned to specific grades in the mathematics blueprint (eight EEs in Grade 9, nine EEs in Grade 10, and nine EEs in Grade 11), a test administrator could choose to test on any of the high school EEs, as all were available in the system. | ||||
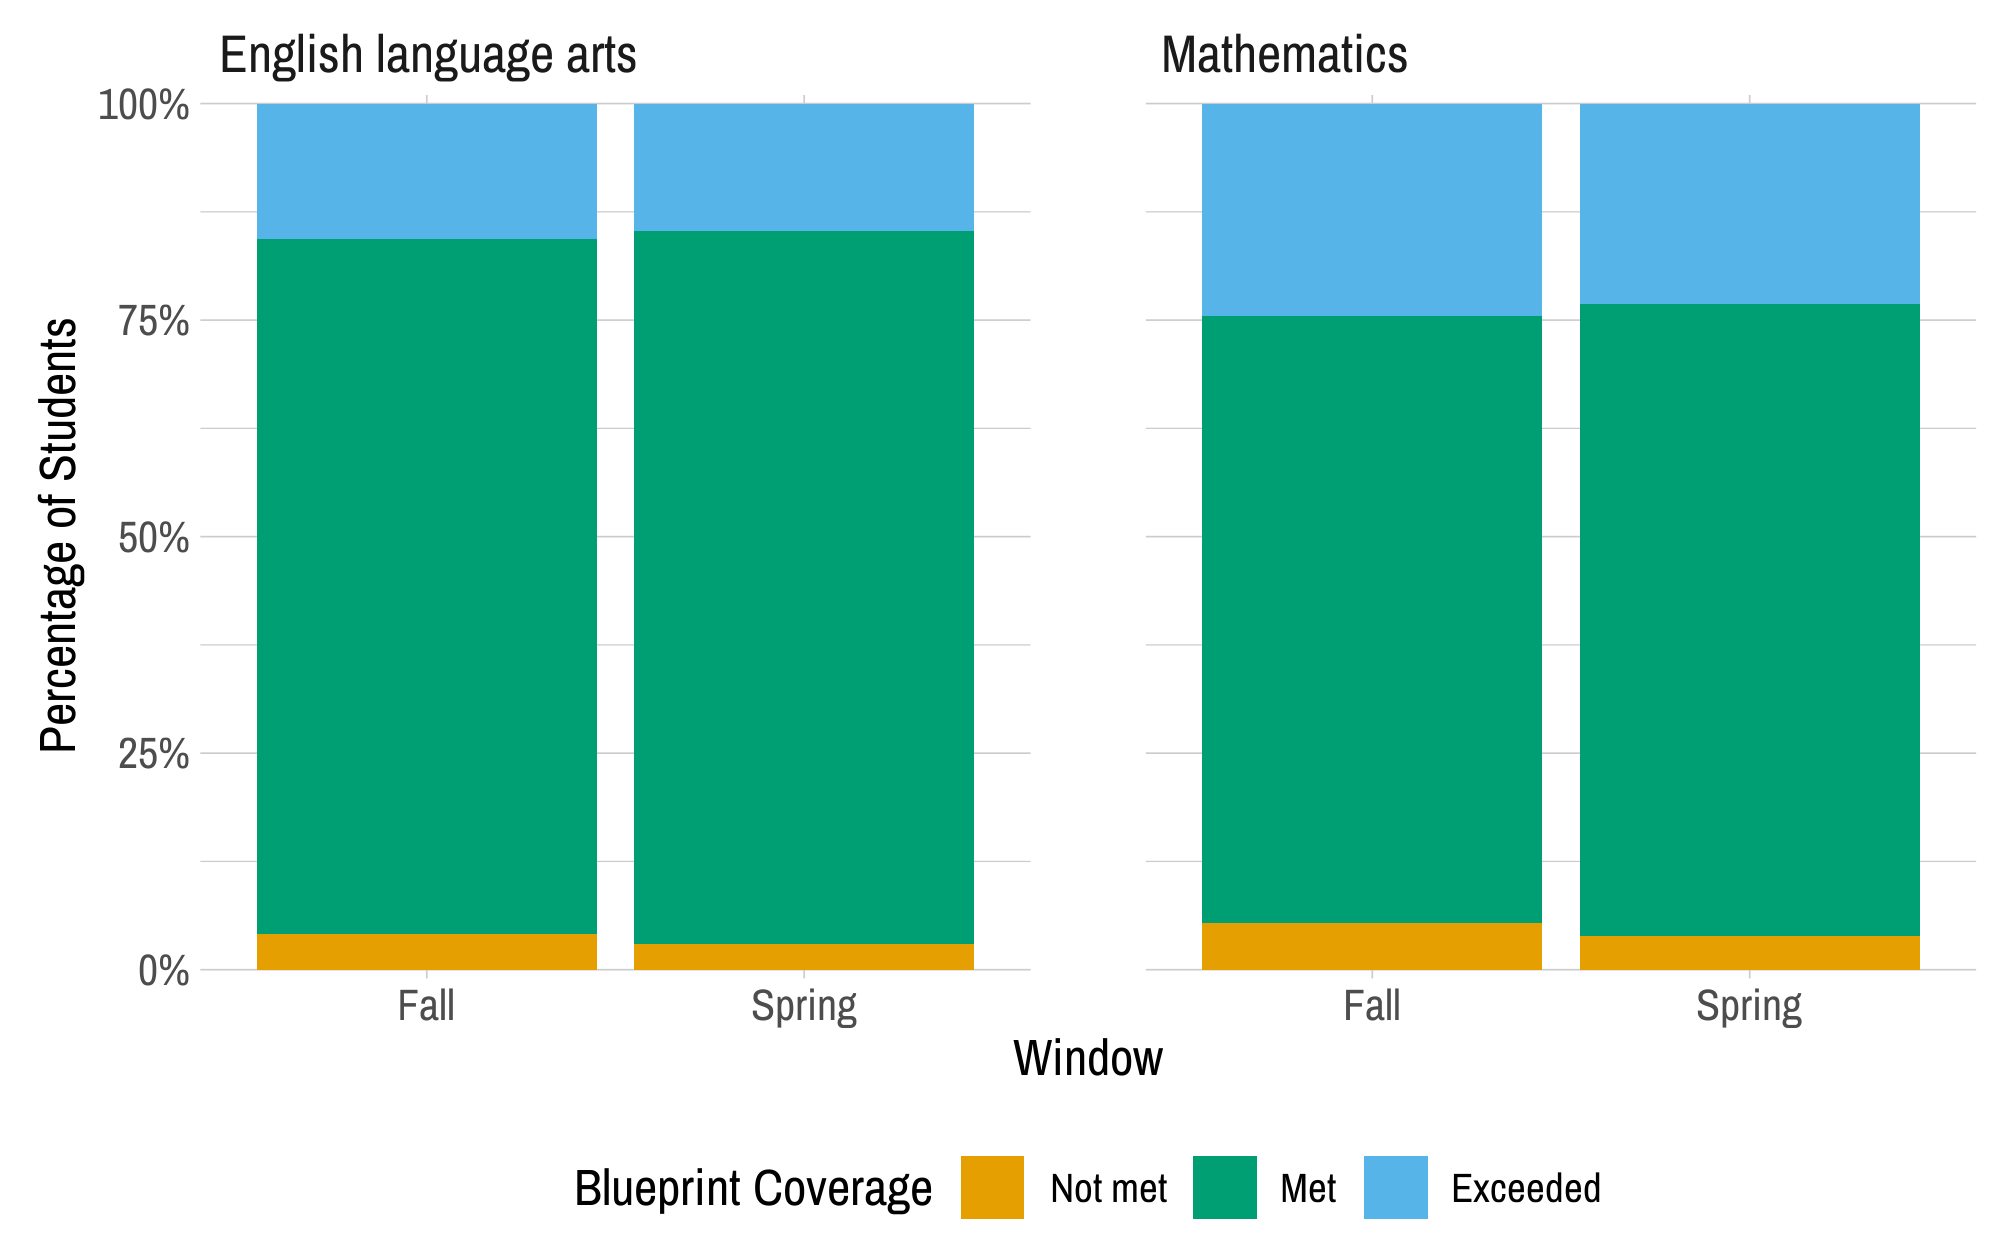
Figure 4.1 summarizes the percentage of students, for each window and overall for the year, in three categories: students who did not meet all blueprint requirements, students who met all blueprint requirements exactly, and students who exceeded the blueprint requirements. Across both subjects and windows, 98% of students in ELA and 98% of students in mathematics met or exceeded blueprint coverage requirements. The coverage rates were slightly lower in the fall compared to the spring.
Figure 4.1: Student Blueprint Coverage Status
4.2.2 Linkage Level Selection
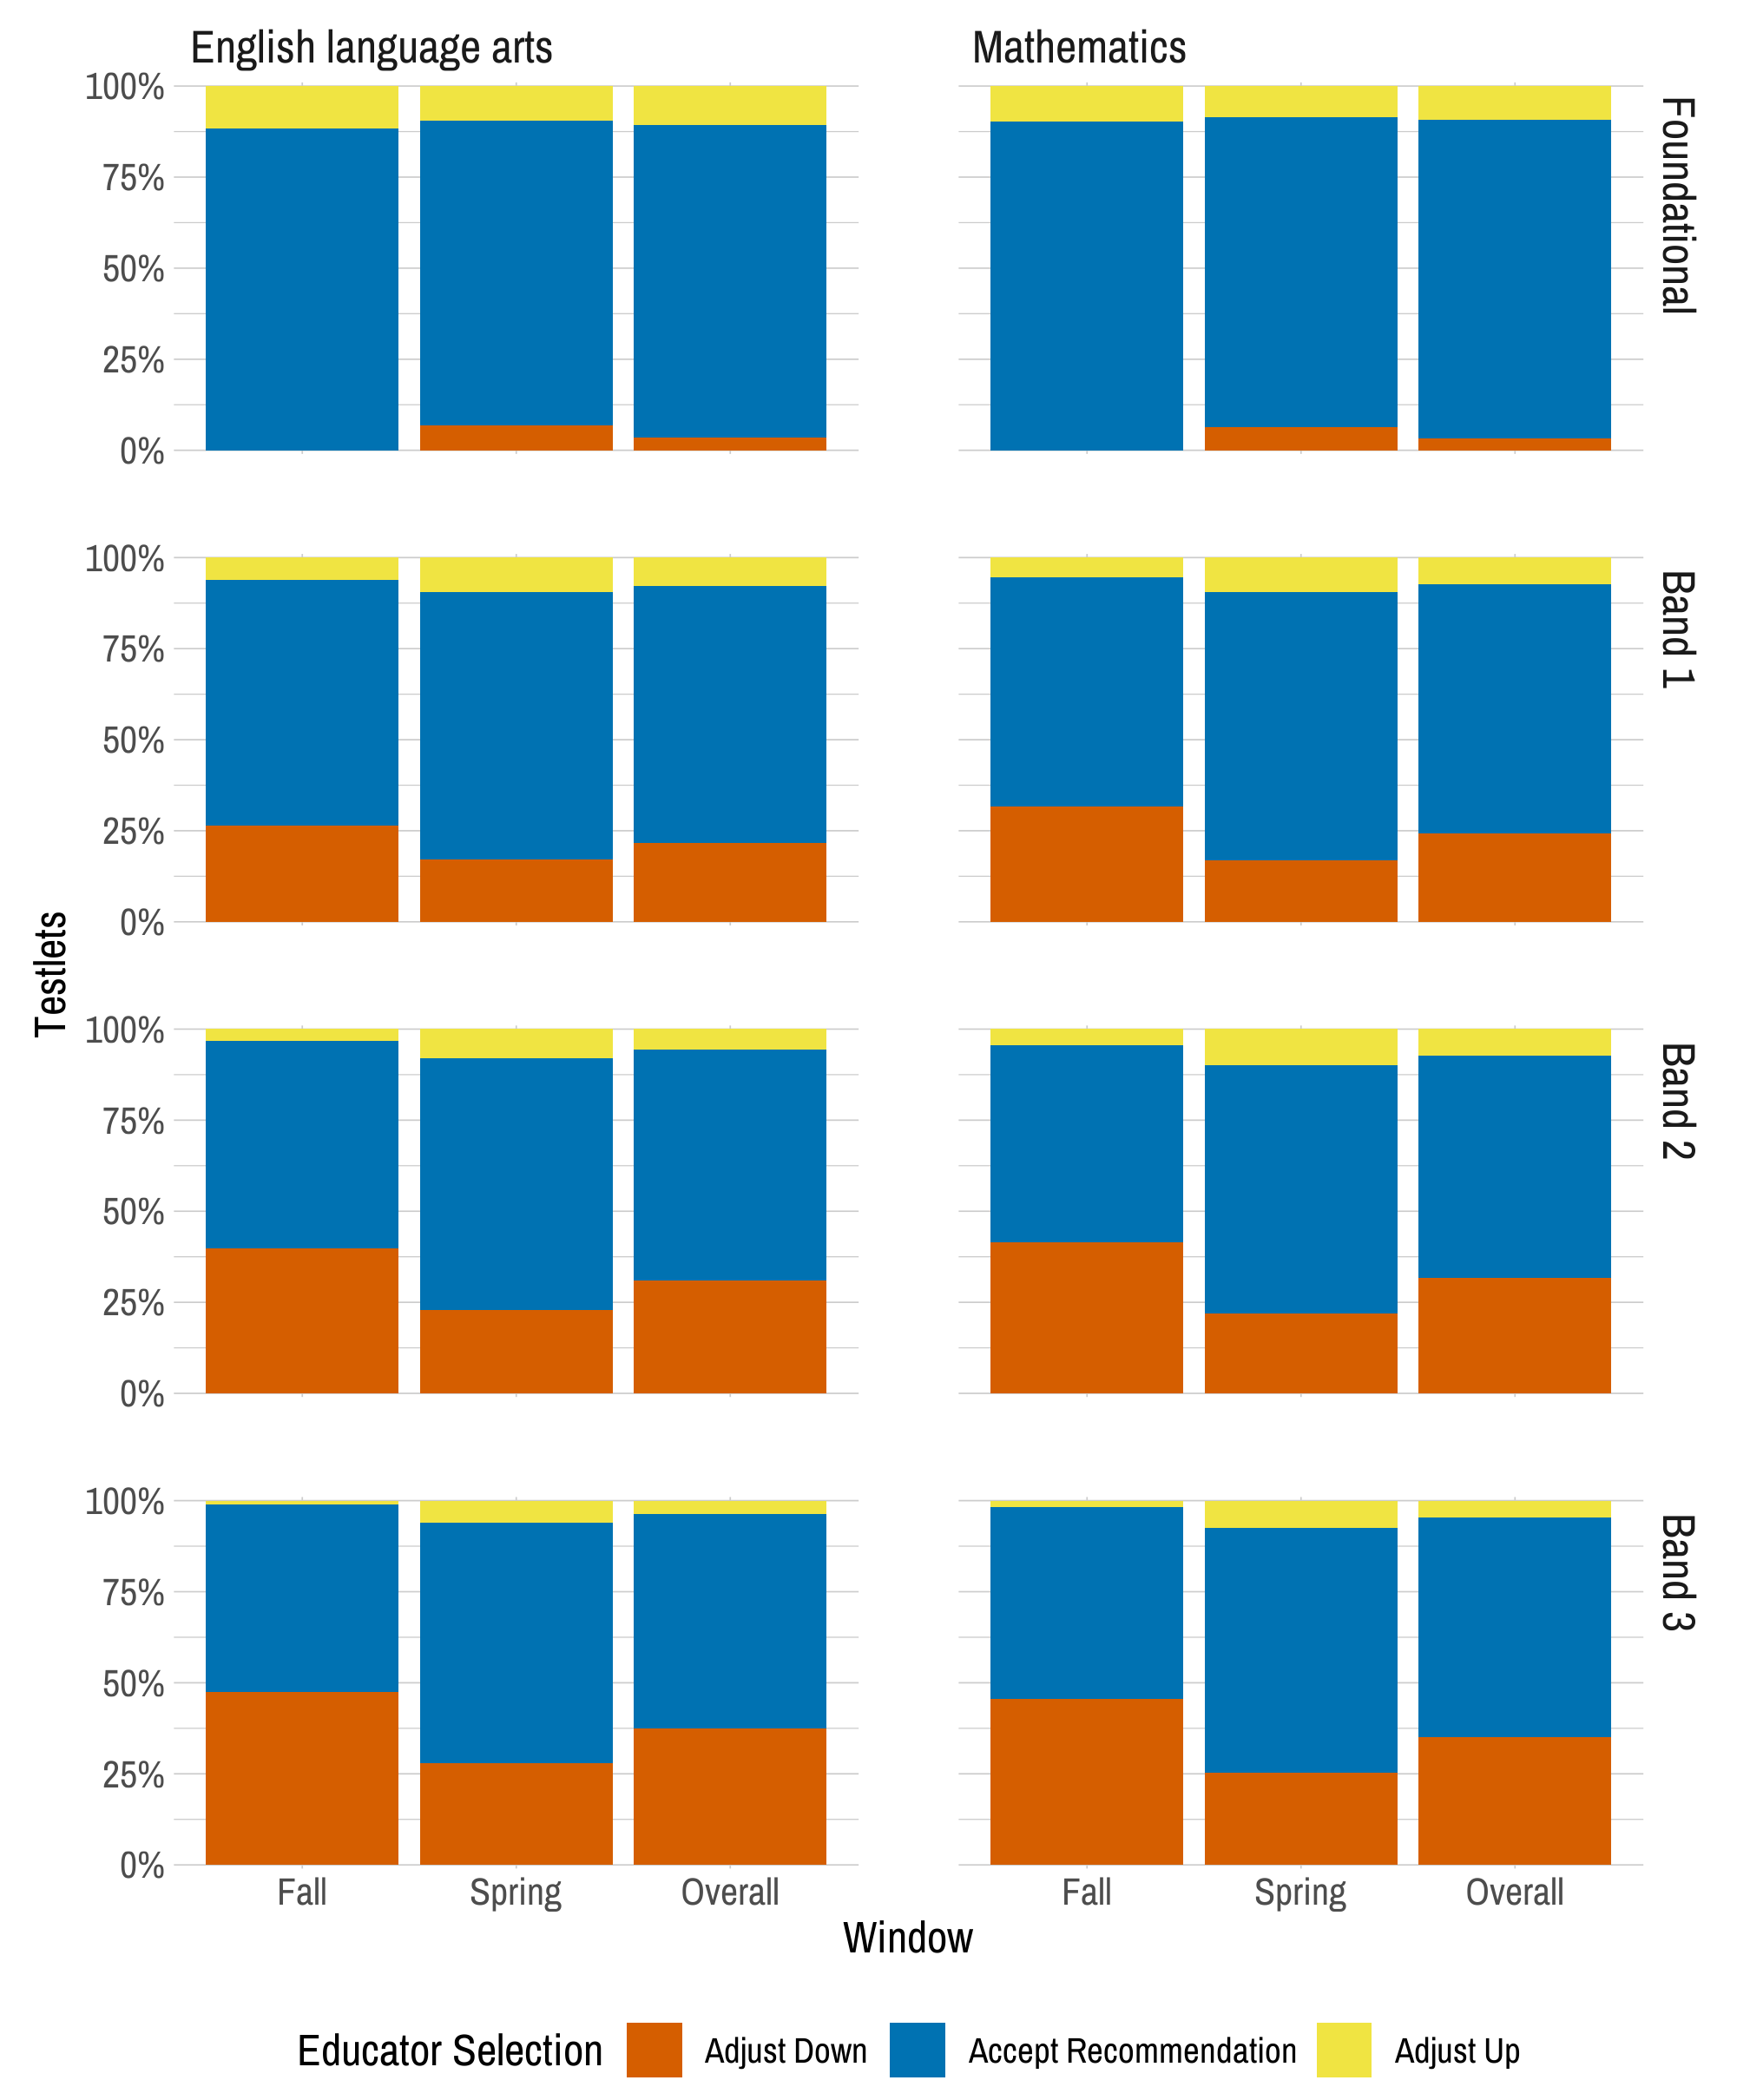
The Instruction and Assessment Planner recommends the linkage level for each EE using information about the student. The teacher can accept the recommendation or assign a different linkage level. Figure 4.2 shows the percentage of testlets that were administered at the system-recommended linkage level or adjusted from the recommended level. Test administrators may choose to administer multiple testlets for a single EE at multiple linkage levels. Because the recommended linkage level for subsequent testlets on the same EE does not change within each window, we only examined adjustments for the first testlets administered for each student on each EE. Across both windows, 73% of ELA testlets and 71% of mathematics testlets were administered at the recommended linkage level. The most common adjustment was to administer a linkage level below the recommended level. This downward adjustment occurred in 19% of ELA testlets and 21% of mathematics testlets. In contrast, 7% of ELA testlets and 8% of mathematics testlets were administered above the recommended level. Finally, across all students and testlets, 53% of ELA test administrators and 51% of mathematics test administrators made at least one upward adjustment.
Figure 4.2: Educator Adjustment of Recommended Linkage Levels, by Complexity Band
Based on the test administrators’ linkage level selections, Table 4.2 shows the total number of testlets that were administered at each linkage level by subject and window. Because test administrators do not select a specific linkage level for writing testlets, those testlets are not included in Table 4.2. For both subjects and windows, the majority of testlets were administered at the Initial Precursor or Distal Precursor linkage level. Additionally, there was a slight increase in the percentage of testlets administered at the Target and Successor linkage levels in the spring window for both subjects.
|
Fall window
|
Spring window
|
|||
|---|---|---|---|---|
| Linkage level | n | % | n | % |
| English language arts | ||||
| Initial Precursor | 47,179 | 36.0 | 45,246 | 33.5 |
| Distal Precursor | 47,236 | 36.0 | 42,667 | 31.6 |
| Proximal Precursor | 26,603 | 20.3 | 29,461 | 21.8 |
| Target | 9,148 | 7.0 | 14,291 | 10.6 |
| Successor | 1,015 | 0.8 | 3,568 | 2.6 |
| Mathematics | ||||
| Initial Precursor | 63,015 | 40.2 | 63,527 | 39.4 |
| Distal Precursor | 60,113 | 38.4 | 53,070 | 32.9 |
| Proximal Precursor | 26,488 | 16.9 | 30,183 | 18.7 |
| Target | 6,104 | 3.9 | 11,950 | 7.4 |
| Successor | 1,005 | 0.6 | 2,492 | 1.5 |
4.2.3 Administration Incidents
DLM staff annually evaluate testlet assignment to promote correct assignment of testlets to students. Administration incidents that have the potential to affect scoring are reported to state education agencies in a supplemental Incident File. No incidents were observed during the 2024–2025 operational assessment windows. Assignment of testlets will continue to be monitored in subsequent years to track any potential incidents and report them to state education agencies.
4.2.4 Accessibility Support Selections
Accessibility supports provided in 2024–2025 were the same as those available in previous years. The DLM Accessibility Manual (Dynamic Learning Maps Consortium, 2025b) distinguishes accessibility supports that are provided in Kite Student Portal via the Personal Needs and Preferences Profile, those that require additional tools or materials, and those that are provided by the test administrator outside the system. Table 4.3 shows selection rates for the three categories of accessibility supports. Multiple supports can be selected for each student. Overall, 19,949 students enrolled in the DLM system (86%) had at least one support selected. The most selected supports in 2024–2025 were human read aloud, spoken audio, and test administrator enters responses for student. For a complete description of the available accessibility supports, see Chapter 4 of the 2021–2022 Technical Manual—Instructionally Embedded Model (Dynamic Learning Maps Consortium, 2022).
| Support | n | % |
|---|---|---|
| Supports provided in Kite Student Portal | ||
| Spoken audio | 13,633 | 58.7 |
| Magnification | 2,670 | 11.5 |
| Color contrast | 1,969 | 8.5 |
| Overlay color | 580 | 2.5 |
| Invert color choice | 382 | 1.6 |
| Supports requiring additional tools/materials | ||
| Individualized manipulatives | 6,505 | 28.0 |
| Calculator | 4,022 | 17.3 |
| Single-switch system | 707 | 3.0 |
| Alternate form–visual impairment | 565 | 2.4 |
| Two-switch system | 210 | 0.9 |
| Uncontracted braille | 34 | 0.1 |
| Supports provided outside the system | ||
| Human read aloud | 17,022 | 73.3 |
| Test administrator enters responses for student | 12,238 | 52.7 |
| Partner-assisted scanning | 1,123 | 4.8 |
| Sign interpretation of text | 267 | 1.1 |
| Language translation of text | 146 | 0.6 |
4.2.5 Participation by Nonsymbolic Communicators
A subset of students who take DLM assessments communicate only through non-symbolic means such as unique gestures, movements, and expressions. Representing about 7%–9% of students with the most significant cognitive disabilities, these students are often excluded or prematurely stopped in other assessments requiring symbolic responses. The DLM system prioritizes their inclusion, using an expanded cognitive process taxonomy (Bechard et al., 2021) and universal design for learning principles. Testlets at the Initial Precursor level are designed to capture a range of intentional and pre-intentional responses, enabling educators to detect progress toward grade-level expectations. To evaluate the DLM approach to assessment design for this subpopulation of students, we examined student data from 2022–-2023 (Erickson & Karvonen, 2025). Around 7% of students taking DLM assessments communicated in only nonsymbolic ways. Of these students, 93% responded to at least one assessment item correctly and many demonstrated mastery of at least one linkage level (75% in ELA and 67% in mathematics). Only 0.17% of these students did not make an observable response to any items. We also found that the percentage of nonsymbolic communicators decreased across grade bands, suggesting students are making progress in symbolic communication over time.
4.3 Evidence From Monitoring Assessment Administration
DLM staff monitor assessment administration using various materials and strategies. As in prior years, DLM staff made available an assessment administration observation protocol for use by DLM staff, state education agency staff, and local education agency staff. DLM staff also reviewed Service Desk requests and hosted regular check-in calls with state education agency staff to monitor common issues and concerns during the assessment window. This section provides an overview of the assessment administration observation protocol and its use.
4.3.1 Test Administration Observations
Consistent with previous years, the DLM Consortium used a test administration observation protocol to gather information about how educators in the consortium states deliver testlets to students with the most significant cognitive disabilities. This protocol gave observers, regardless of their role or experience with DLM assessments, a standardized way to describe how DLM testlets were administered. The test administration observation protocol captured data about student actions (e.g., navigation, responding), educator assistance, variations from standard administration, student engagement, and barriers to engagement. Because the protocol does not differ by administration model (i.e., Instructionally Embedded or Year-End), we report all results here. For a full description of the test administration observation protocol, see Chapter 4 of the 2021–2022 Technical Manual—Instructionally Embedded Model (Dynamic Learning Maps Consortium, 2022).
During 2024–2025, there were 390 assessment administration observations collected in six states. Table 4.4 shows the number of observations collected by state. Of the 390 total observations, 258 (66%) were of computer-delivered assessments and 132 (34%) were of educator-administered testlets. The observations were for 228 (58%) ELA reading testlets, 15 (4%) ELA writing testlets, and 147 (38%) mathematics testlets.
| State | n | % |
|---|---|---|
| Arkansas | 69 | 17.7 |
| Colorado | 6 | 1.5 |
| Iowa | 96 | 24.6 |
| Kansas | 24 | 6.2 |
| Missouri | 95 | 24.4 |
| West Virginia | 100 | 25.6 |
Table 4.5 summarizes observations for computer-delivered testlets; behaviors on the test administration observation protocol were identified as supporting, neutral, or nonsupporting. For example, clarifying directions (found in 36% of observations) removes student confusion about the task demands as a source of construct-irrelevant variance and supports the student’s meaningful, construct-related engagement with the item. In contrast, using physical prompts (e.g., hand-over-hand guidance) indicates that the test administrator directly influenced the student’s answer choice. Overall, 54% of observed behaviors were classified as supporting, with 1% of observed behaviors reflecting nonsupporting actions.
| Action | n | % |
|---|---|---|
| Supporting | ||
| Read one or more screens aloud to the student | 187 | 47.9 |
| Clarified directions or expectations for the student | 139 | 35.6 |
| Navigated one or more screens for the student | 117 | 30.0 |
| Repeated question(s) before student responded | 79 | 20.3 |
| Neutral | ||
| Used verbal prompts to direct the student’s attention or engagement (e.g., “look at this.”) | 125 | 32.1 |
| Used pointing or gestures to direct student attention or engagement | 103 | 26.4 |
| Entered one or more responses for the student | 61 | 15.6 |
| Used materials or manipulatives during the administration process | 45 | 11.5 |
| Asked the student to clarify or confirm one or more responses | 44 | 11.3 |
| Allowed student to take a break during the testlet | 31 | 7.9 |
| Repeated question(s) after student responded (gave a second trial at the same item) | 23 | 5.9 |
| Nonsupporting | ||
| Physically guided the student to a response | 5 | 1.3 |
| Reduced the number of answer choices available to the student | 5 | 1.3 |
| Note. Respondents could select multiple responses to this question. | ||
For DLM assessments, interaction with the system includes interaction with the assessment content as well as physical access to the testing device and platform. The fact that educators navigated one or more screens in 30% of the observations does not necessarily indicate the student was prevented from engaging with the assessment content as independently as possible. Depending on the student, test administrator navigation may either support or minimize students’ independent, physical interaction with the assessment system. While not the same as interfering with students’ interaction with the content of the assessment, navigating for students who are able to do so independently conflicts with the assumption that students are able to interact with the system as intended. The observation protocol did not capture why the test administrator chose to navigate, and the reason was not always obvious.
Observations of student actions taken during computer-delivered testlets are summarized in Table 4.6. Independent response selection was observed in 74% of the cases. Nonindependent response selection may include allowable practices, such as test administrators entering responses for the student. The use of materials outside of Kite Student Portal was seen in 9% of the observations. Verbal prompts for navigation and response selection are strategies within the realm of allowable flexibility during test administration. These strategies, which are commonly used during direct instruction for students with the most significant cognitive disabilities, are used to maximize student engagement with the system and promote the type of student-item interaction needed for a construct-relevant response. However, they also indicate that students were not able to sustain independent interaction with the system throughout the entire testlet.
| Action | n | % |
|---|---|---|
| Selected answers independently | 191 | 74.0 |
| Navigated screens independently | 146 | 56.6 |
| Navigated screens after verbal prompts | 85 | 32.9 |
| Selected answers after verbal prompts | 71 | 27.5 |
| Navigated screens after test administrator pointed or gestured | 63 | 24.4 |
| Used materials outside of Kite Student Portal to indicate responses to testlet items | 24 | 9.3 |
| Asked the test administrator a question | 17 | 6.6 |
| Revisited one or more questions after verbal prompt(s) | 10 | 3.9 |
| Independently revisited a question after answering it | 9 | 3.5 |
| Skipped one or more items | 7 | 2.7 |
| Note. Respondents could select multiple responses to this question. |
Observers noted whether there was difficulty with accessibility supports (including lack of appropriate available supports) during observations of educator-administered testlets. Of the 132 observations of educator-administered testlets, observers noted difficulty in seven cases (5%). For computer-delivered testlets, observers noted students who indicated responses to items using varied response modes such as gesturing (17%) and using manipulatives or materials outside of the Kite system (9%). Of the 258 observations of computer-delivered testlets, 256 (99%) indicated the student completed the full testlet. Similarly, of the 132 observations of educator-administered testlets, 130 (98%) indicated the student completed the full testlet.
Finally, DLM assessment administration observation intends for test administrators to enter student responses with fidelity, including across multiple modes of communication, such as verbal, gesture, and eye gaze. Table 4.7 summarizes students’ response modes for educator-administered testlets. The most frequently observed behavior was gestured to indicate response to test administrator who selected answers.
| Response mode | n | % |
|---|---|---|
| Gestured to indicate response to test administrator who selected answers | 79 | 59.8 |
| Verbally indicated response to test administrator who selected answers | 54 | 40.9 |
| No observable response mode | 14 | 10.6 |
| Eye gaze system indication to test administrator who selected answers | 5 | 3.8 |
| Note. Respondents could select multiple responses to this question. |
Observations of computer-delivered testlets when test administrators entered responses on behalf of students provided another opportunity to confirm fidelity of response entry. This support is recorded on the Personal Needs and Preferences Profile and is recommended for a variety of situations (e.g., students who have limited motor skills and cannot interact directly with the testing device even though they can cognitively interact with the onscreen content). Observers recorded whether the response entered by the test administrator matched the student’s response. In 61 of 258 (24%) observations of computer-delivered testlets, the test administrator entered responses on the student’s behalf. In 58 (95%) of those cases, observers indicated that the entered response matched the student’s response, while the remaining observers responded that they could not tell if the entered response matched the student’s response.
4.4 Evidence From Test Administrators
This section describes evidence collected from the spring 2025 test administrator survey. Test administrators receive one survey per rostered DLM student, which annually collects information about that student’s assessment experience. As in previous years, the survey was distributed to test administrators in Kite Student Portal, where students completed assessments. Instructions indicated the test administrator should complete the survey after administration of the spring assessment; however, users can complete the survey at any time. The survey consisted of three blocks. Blocks 1 and 3 were administered in every survey. Block 1 included questions about the test administrator’s perceptions of the assessments and the student’s interaction with the content. Block 3 included questions about the test administrator’s background, to be completed once per administrator. Block 2 was spiraled, so test administrators received one randomly assigned section. In these sections, test administrators responded to questions about a single topic (e.g., relationship of the assessment to ELA, mathematics, or science instruction).
4.4.1 User Experience With the DLM System
A total of 4,010 test administrators (61%) responded to the survey about 9,720 students’ experiences. Test administrators are instructed to respond to the survey separately for each of their students. Participating test administrators responded to surveys for between 1 and 26 students, with a median of 2 students. Test administrators most commonly reported having 11–20 years of experience in ELA, 11–20 years in mathematics, and 2–5 years teaching students with significant cognitive disabilities. Most of the survey respondents (70%) were the student’s primary teacher in the subject assessed, while other respondents included case managers (18%), other teachers (7%), and others (5%).
The following sections summarize responses regarding both educator and student experiences with the DLM system.
4.4.1.1 Educator Experience
Test administrators were asked to reflect on their own experience with the assessments as well as their comfort level and knowledge administering them. Most of the questions required test administrators to respond on a 4-point scale: strongly disagree, disagree, agree, or strongly agree. Table 4.8 summarizes responses.
Nearly all test administrators (96%) agreed or strongly agreed that they were confident administering DLM testlets. Most respondents (91%) agreed or strongly agreed that Required Test Administrator Training prepared them for their responsibilities as test administrators. Most test administrators agreed or strongly agreed that they had access to curriculum aligned with the content that was measured by the assessments (88%) and that they used the manuals and the Educator Resource Page (92%).
|
SD
|
D
|
A
|
SA
|
A+SA
|
||||||
|---|---|---|---|---|---|---|---|---|---|---|
| Statement | n | % | n | % | n | % | n | % | n | % |
| I was confident in my ability to deliver DLM testlets. | 30 | 0.9 | 90 | 2.7 | 1,540 | 46.3 | 1,665 | 50.1 | 3,205 | 96.4 |
| Required Test Administrator Training prepared me for the responsibilities of a test administrator. | 80 | 2.4 | 217 | 6.5 | 1,702 | 51.2 | 1,327 | 39.9 | 3,029 | 91.1 |
| I have access to curriculum aligned with the content measured by DLM assessments. | 94 | 2.8 | 315 | 9.5 | 1,714 | 51.5 | 1,206 | 36.2 | 2,920 | 87.7 |
| I used manuals and/or the DLM Educator Resource Page materials. | 59 | 1.8 | 219 | 6.6 | 1,864 | 55.9 | 1,192 | 35.8 | 3,056 | 91.7 |
| Note. SD = strongly disagree; D = disagree; A = agree; SA = strongly agree; A+SA = agree and strongly agree. | ||||||||||
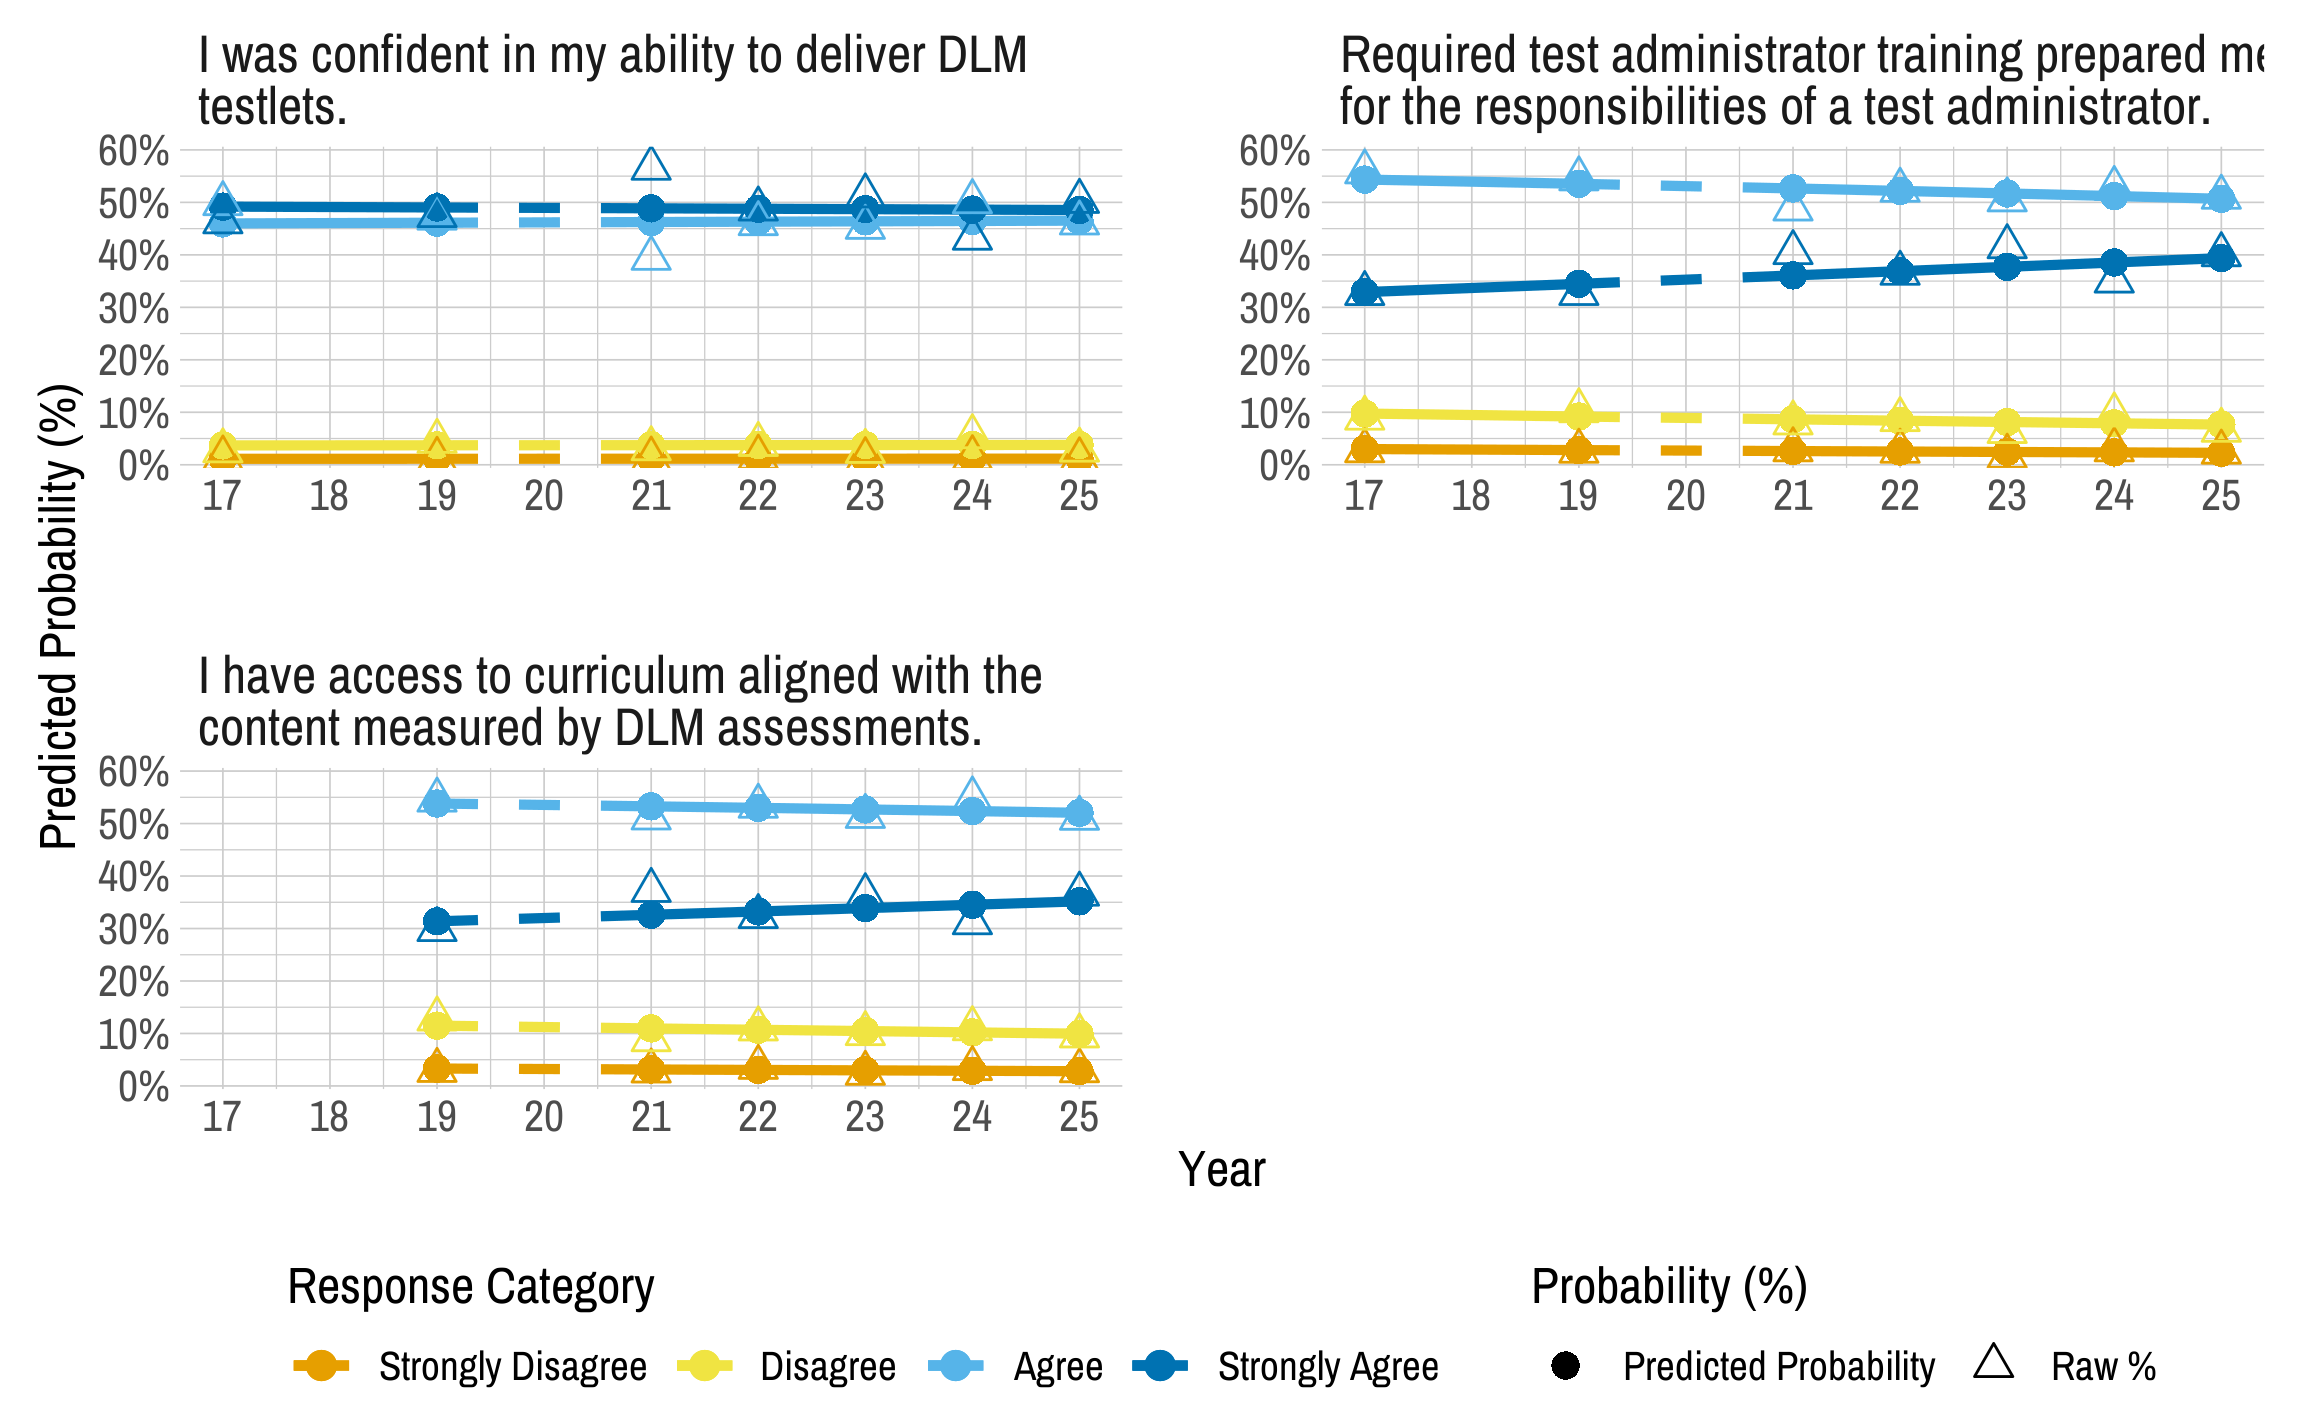
We evaluated longitudinal trends for a subset of educator experience items using an ordered logistic regression model (See Section 3.3.2.1 for the analytical methods). Figure 4.3 presents longitudinal trends in educator experience by showing the raw percentage of each response category (triangles) and the predicted probability of selecting each category (circles) across years, separately by item. In each year, more than 80% of educators agreed with each statement. The agreement with the statement, “I was confident in my ability to deliver DLM testlets,” remained consistently high over time without significant change (odds ratio = 0.997, 95% CI [0.986, 1.008]). The percentage of test administrators strongly agreeing with the statement, “Required test administrator training prepared them for their responsibilities as test administrators,” increased toward 2025. The odds of selecting a higher level of agreement with the statement increased by 3.6% per year (odds ratio = 1.036, 95% CI [1.024, 1.047]). The odds of selecting a higher level of agreement with the statement, “I have access to curriculum aligned with the content measured by DLM assessments,” increased by 2.9% per year (odds ratio = 1.029, 95% CI [1.015, 1.043]). Overall, test administrators’ experiences remained positive and showed a gradual improvement over time. However, it is important to note that the sample of teachers who respond to the survey each year is different, and the student population they are referencing when answering these questions has also changed over time.
Figure 4.3: Longitudinal Trends in Educator Experience
4.4.1.2 Student Experience
The spring 2025 test administrator survey included three items about how students responded to test items. Test administrators were asked to rate statements from strongly disagree to strongly agree. Table 4.9 presents the results. For the majority of students, test administrators agreed or strongly agreed that their students responded to items to the best of their knowledge, skills, and understandings; were able to respond regardless of disability, behavior, or health concerns; and had access to all necessary supports to participate.
|
SD
|
D
|
A
|
SA
|
A+SA
|
||||||
|---|---|---|---|---|---|---|---|---|---|---|
| Statement | n | % | n | % | n | % | n | % | n | % |
| Student responded to items to the best of their knowledge, skills, and understanding. | 359 | 4.1 | 720 | 8.3 | 4,553 | 52.4 | 3,058 | 35.2 | 7,611 | 87.6 |
| Student was able to respond regardless of their disability, behavior, or health concerns. | 571 | 6.6 | 824 | 9.5 | 4,467 | 51.3 | 2,847 | 32.7 | 7,314 | 84.0 |
| Student had access to all necessary supports to participate. | 276 | 3.2 | 435 | 5.0 | 4,641 | 53.5 | 3,324 | 38.3 | 7,965 | 91.8 |
| Note. SD = strongly disagree; D = disagree; A = agree; SA = strongly agree; A+SA = agree and strongly agree. | ||||||||||
Annual survey results show that a small percentage of test administrators disagree that their student was able to respond regardless of disability, behavior, or health concerns; had access to all necessary supports; and was able to effectively use supports.
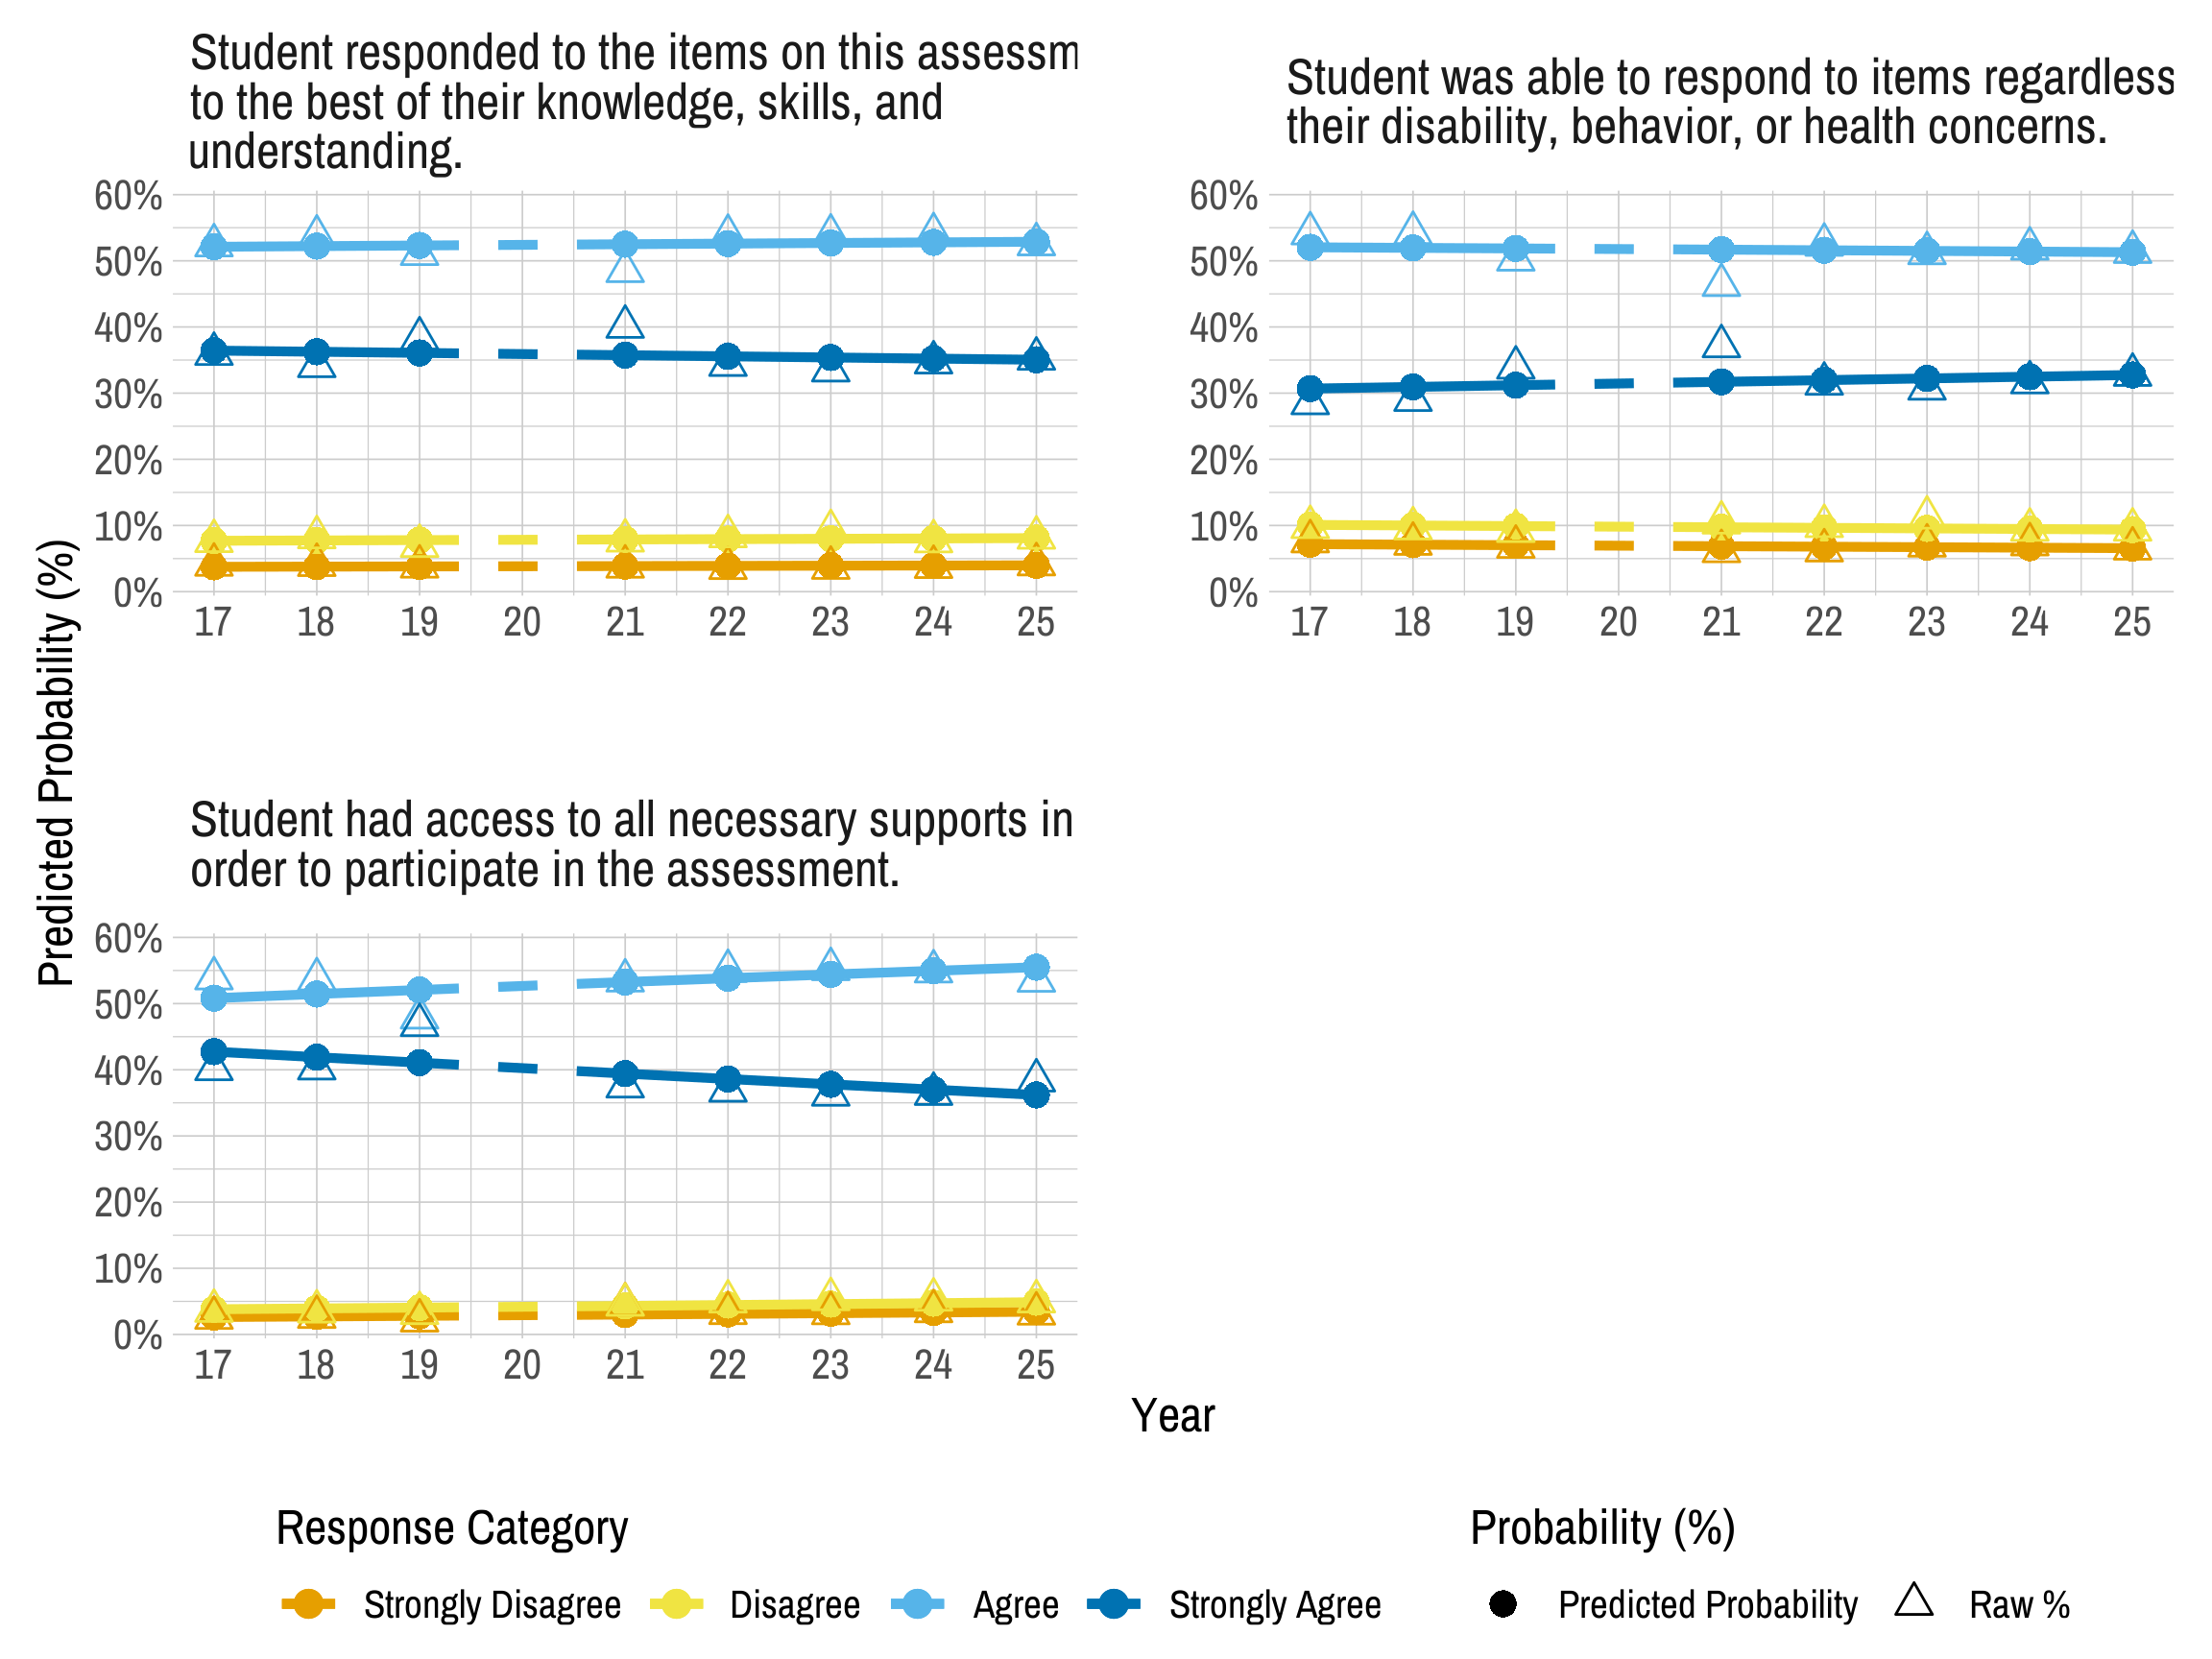
We evaluated longitudinal trends in student experience with an ordered logistic regression model (See Section 3.3.2.1 for the analytical methods). Figure 4.4 presents longitudinal trends in educators’ perceptions of student experience with testlets by showing the raw percentage of each response category (triangles) and the predicted probability of selecting each category (circles) across years, separately by item. Overall, educators reported consistently high agreement across items. The percentages of agreement with the statement, “Students responded to the items on the assessment to the best of their knowledge, skills, and understanding,” were consistently higher than those of disagreement with the statement. However, the overall trend decreased slightly across years, as the odds of selecting a higher level of agreement declined slightly by 0.7% per year (odds ratio = 0.993, 95% CI [0.987, 0.998]). Educators also showed consistently high agreement with the statement, “Student was able to respond to items regardless of their disability, behavior, or health concerns.” More than 80% of them agreed with the statement across years, and the overall trend increased slightly, as the odds of selecting a higher level of agreement with the statement increased by 1.2% per year (odds ratio = 1.012, 95% CI [1.007, 1.017]). The percentages of educators agreeing with the statement, “Students had access to all necessary support in order to participate in the assessment,” were approximately 90% across years. Due to the decrease in the percentage of educators strongly agreeing with the statement toward 2025, the odds of selecting a higher level of agreement with the statement decreased by 3.4% per year (odds ratio = 0.966, 95% CI [0.961, 0.971]). Overall, teachers’ perspectives about student experience with testlets remained largely stable, with some mixed trends over time. However, it is important to note that the sample of teachers who respond to the survey each year is different, and the student population they are referencing when answering these questions has also changed over time.
Figure 4.4: Longitudinal Trends in Educators’ Agreement on Student Experience with Testlets
4.4.2 Opportunity to Learn
The spring 2025 test administrator survey also included items about students’ opportunity to learn academic content measured by DLM assessments. Table 4.10 reports the opportunity to learn results.
Approximately 78% of responses (n = 6,836) for ELA and 75% (n = 6,525) for mathematics reported that most or all testlets matched instruction.
|
None
|
Some (<half)
|
Most (>half)
|
All
|
Not applicable
|
||||||
|---|---|---|---|---|---|---|---|---|---|---|
| Subject | n | % | n | % | n | % | n | % | n | % |
| English language arts | 328 | 3.8 | 1,453 | 16.6 | 3,305 | 37.8 | 3,531 | 40.4 | 122 | 1.4 |
| Mathematics | 312 | 3.6 | 1,690 | 19.5 | 3,225 | 37.2 | 3,300 | 38.1 | 145 | 1.7 |
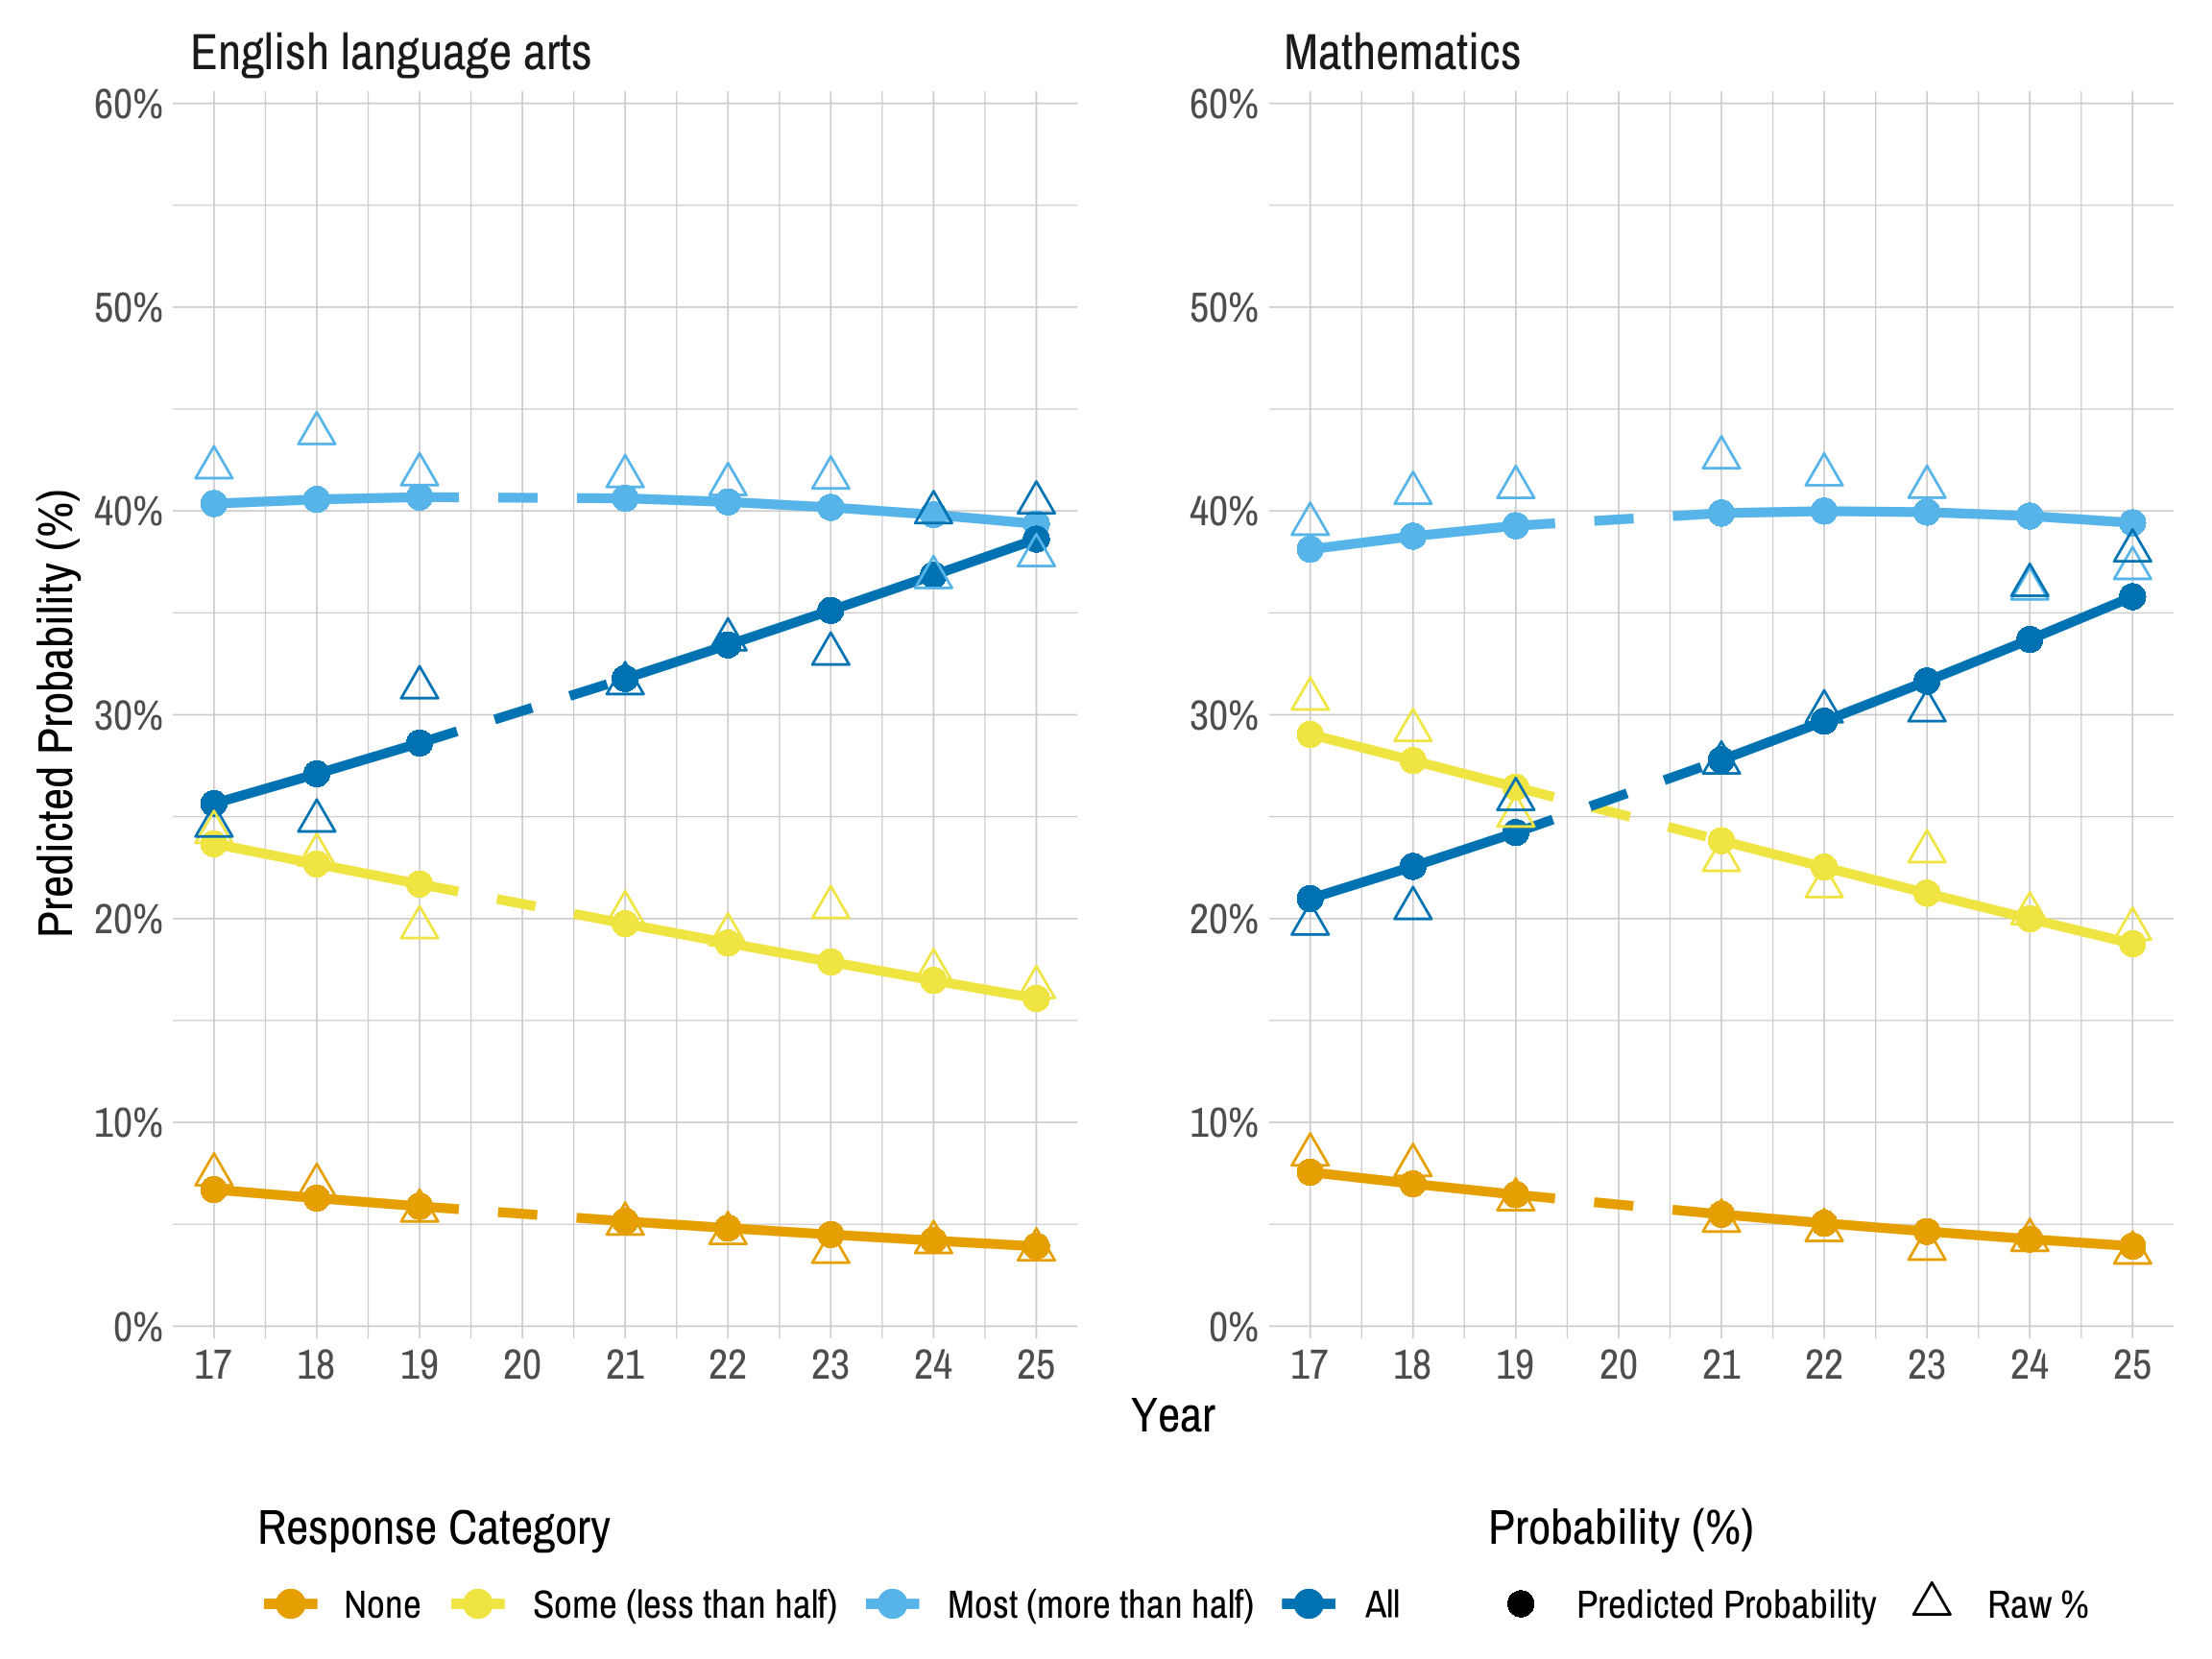
We evaluated longitudinal trends in educator ratings of the portion of testlets that matched instruction using an ordered logistic regression model (See Section 3.3.2.1 for the analytical methods). Figure 4.5 presents longitudinal trends in educators’ ratings of portion of ELA and mathematics testlets that matched instruction. In both subjects, the highest percentage of educators reported “most” of the testlets matched instruction in both subjects across years. The percentage of test administrators reporting “all” testlets matched instruction significantly increased up to approximately 40% in both subjects by 2025. The odds of educators’ rating a higher proportion of English language arts testlets as matching instruction increased by 7.8% per year (odds ratio = 1.078, 95% CI [1.073, 1.083], p < 0.001). Similarly, the odds for mathematics testlets increased by 9.7% per year (odds ratio = 1.097, 95% CI [1.092, 1.103], p < 0.001). Overall, these results indicate a consistent upward trend in test administrators’ perceptions of testlet alignment with instruction over time.
Figure 4.5: Longitudinal Trends in Educator Ratings of Portion of Testlets That Matched Instruction
In addition to the fixed questions answered by all participants, the survey included spiraled content, where test administrators responded to different blocks of items to provide feedback across a broad range of topics. On these blocks, a subset of test administrators was asked to indicate the approximate number of hours in total spent instructing students on each of the conceptual areas by subject (i.e., ELA, mathematics) during the 2024–2025 year. Test administrators responded using a 6-point scale: 0 hours, 1–5 hours, 6–10 hours, 11–15 hours, 16–20 hours, or more than 20 hours. Table 4.11 and Table 4.12 indicate the amount of instructional time spent on conceptual areas for ELA and mathematics, respectively. On average, 42% of the test administrators provided at least 11 hours of instruction per conceptual area to their students in ELA, compared to 41% in mathematics.
|
Number of hours
|
|||||||||||||
|---|---|---|---|---|---|---|---|---|---|---|---|---|---|
|
0
|
1–5
|
6–10
|
11–15
|
16–20
|
>20
|
||||||||
| Conceptual area | Median | n | % | n | % | n | % | n | % | n | % | n | % |
| Determine critical elements of text | 11–15 | 135 | 6.9 | 490 | 25.1 | 349 | 17.9 | 280 | 14.3 | 274 | 14.0 | 426 | 21.8 |
| Construct understandings of text | 6–10 | 210 | 10.8 | 511 | 26.3 | 377 | 19.4 | 250 | 12.9 | 258 | 13.3 | 334 | 17.2 |
| Integrate ideas and information from text | 6–10 | 236 | 12.2 | 511 | 26.4 | 391 | 20.2 | 260 | 13.4 | 235 | 12.2 | 301 | 15.6 |
| Use writing to communicate | 6–10 | 234 | 12.1 | 557 | 28.9 | 349 | 18.1 | 255 | 13.2 | 235 | 12.2 | 299 | 15.5 |
| Integrate ideas and information in writing | 6–10 | 341 | 17.7 | 552 | 28.6 | 321 | 16.6 | 240 | 12.4 | 223 | 11.6 | 253 | 13.1 |
| Use language to communicate with others | 11–15 | 117 | 6.1 | 465 | 24.1 | 363 | 18.8 | 265 | 13.7 | 286 | 14.8 | 433 | 22.4 |
| Clarify and contribute in discussion | 6–10 | 178 | 9.2 | 509 | 26.4 | 344 | 17.9 | 279 | 14.5 | 269 | 14.0 | 346 | 18.0 |
| Use sources and information | 6–10 | 445 | 23.1 | 513 | 26.6 | 339 | 17.6 | 213 | 11.1 | 196 | 10.2 | 220 | 11.4 |
| Collaborate and present ideas | 6–10 | 420 | 21.8 | 542 | 28.1 | 322 | 16.7 | 219 | 11.3 | 194 | 10.0 | 234 | 12.1 |
|
Number of hours
|
|||||||||||||
|---|---|---|---|---|---|---|---|---|---|---|---|---|---|
|
0
|
1–5
|
6–10
|
11–15
|
16–20
|
>20
|
||||||||
| Conceptual area | Median | n | % | n | % | n | % | n | % | n | % | n | % |
| Understand number structures (counting, place value, fraction) | 11–15 | 214 | 5.3 | 925 | 23.1 | 711 | 17.8 | 527 | 13.2 | 560 | 14.0 | 1,066 | 26.6 |
| Compare, compose, and decompose numbers and steps | 6–10 | 468 | 11.8 | 1,000 | 25.2 | 768 | 19.3 | 556 | 14.0 | 555 | 14.0 | 625 | 15.7 |
| Calculate accurately and efficiently using simple arithmetic operations | 6–10 | 403 | 10.2 | 933 | 23.5 | 687 | 17.3 | 558 | 14.1 | 561 | 14.1 | 826 | 20.8 |
| Understand and use geometric properties of two- and three-dimensional shapes | 6–10 | 532 | 13.5 | 1,144 | 29.0 | 746 | 18.9 | 590 | 14.9 | 507 | 12.8 | 430 | 10.9 |
| Solve problems involving area, perimeter, and volume | 1–5 | 995 | 25.2 | 1,030 | 26.1 | 662 | 16.8 | 476 | 12.1 | 429 | 10.9 | 356 | 9.0 |
| Understand and use measurement principles and units of measure | 6–10 | 678 | 17.3 | 1,159 | 29.5 | 761 | 19.4 | 518 | 13.2 | 444 | 11.3 | 369 | 9.4 |
| Represent and interpret data displays | 6–10 | 681 | 17.3 | 1,124 | 28.6 | 723 | 18.4 | 525 | 13.3 | 476 | 12.1 | 407 | 10.3 |
| Use operations and models to solve problems | 6–10 | 561 | 14.2 | 978 | 24.8 | 677 | 17.2 | 557 | 14.1 | 560 | 14.2 | 612 | 15.5 |
| Understand patterns and functional thinking | 6–10 | 365 | 9.2 | 1,141 | 28.8 | 805 | 20.3 | 592 | 14.9 | 562 | 14.2 | 498 | 12.6 |
Another dimension of opportunity to learn is student engagement during instruction. The First Contact Survey contains two questions that ask educators to rate student engagement during computer- and educator-directed instruction. Table 4.13 shows the percentage of students who were rated as demonstrating different levels of attention by instruction type. Overall, 87% of students demonstrate fleeting or sustained attention to computer-directed instruction and 83% of students demonstrate fleeting or sustained attention to educator-directed instruction, supporting their opportunity to learn the academic content measured by DLM assessments. These high levels of engagement across both computer-delivered and educator-administered instruction also suggest that students are likely to demonstrate similar engagement during DLM computer-delivered and educator-administered assessments.
|
Demonstrates
little or no attention |
Demonstrates
fleeting attention |
Generally
sustains attention |
||||
|---|---|---|---|---|---|---|
| Type of instruction | n | % | n | % | n | % |
| Computer-directed (n = 20,141) | 2,610 | 13.0 | 10,091 | 50.1 | 7,440 | 36.9 |
| Educator-directed (n = 21,378) | 3,741 | 17.5 | 12,677 | 59.3 | 4,960 | 23.2 |
4.5 Conclusion
Delivery of DLM assessments was designed to align with instructional practice and be responsive to individual student needs. Assessment delivery options allow for flexibility to reflect student needs while also including constraints to maximize comparability and support valid interpretation of results. The flexible nature of DLM assessment administration is reflected in the linkage level and the EE selections made by test administrators. Evidence collected from the DLM system, test administration monitoring, and test administrator survey indicates that test administrators are prepared and confident administering DLM assessments, that students are able to successfully interact with the system to demonstrate their knowledge, skills, and understandings, and that students have opportunity to learn the academic content measured by DLM assessments.